Delivering digital humanities workshops has been a major part of my work in libraries, spanning the “big tent” of DH through one-shots, course visits, and week-long institutes. Introducing humanities scholars to new methods and connecting them with the right tools is deeply rewarding—but also uniquely challenging. Workshops can veer toward disaster when seemingly simple instructions, like opening an application or loading a file, bring the room to a standstill. Some learners are stalled by technical errors, others by the instructions themselves. With participants representing a wide range of disciplines and experience levels, it can be hard to find the right pace.
Brandon Walsh describes this as the “three-speed problem” of DH pedagogy: in any given room, instruction will always be too fast for some, too slow for others, and just right for a few (2023). To address this, Walsh proposes low-tech approaches that foreground inquiry over learning to press the right buttons or “buttonology,” per Russell and Hensley (2017). Similarly, Jentery Sayers explores hands-on methods using paper, scissors, glue, and cardboard, shifting the focus from tools to broader discussions about how data are “produced, processed, and expressed” (2019). Inspired by these approaches, I found new possibilities for DH pedagogy at the #DHMakes mini-conference at DH2024. Surrounded by paper, fabric, yarn, and a range of creative engagements with technology, I saw an opportunity to rethink instruction about data to center critical conversations over technical tools.
This piece reflects on my attempt at designing a data physicalization workshop. I share lessons learned, practical pointers, and workshop materials for those interested in integrating crafting into DH pedagogy.
Tracking Changes with Tapestry
In early 2025, the Trump administration began scrubbing federal websites related to gender and diversity, climate science, and healthcare issues. Some websites were temporarily unavailable, such as Census.gov. Among pages deleted on the Center for Disease Control website were health disparities in LGBTQ youth and information on HIV including stigma, living with HIV, and preventing HIV. Other sites were significantly altered, such as the removal of transgender and queer people from the National Park Service Stonewall National Monument.
I have been trying to comprehend these changes and to begin understanding their scope and magnitude. At the time of writing this, there is no comprehensive dataset of these edits. Even if all the links were captured, a dataset alone would not capture details such as choices in design, emphasis, language, and linked resources.
For example, the Stonewall page’s banner once featured a drag performance but was replaced with a rear view of George Segal’s Gay Liberation sculpture. Using the Wayback Changes tool, I compared the January 19th, 2025 version with its revised state, visualizing insertions and deletions side by side.
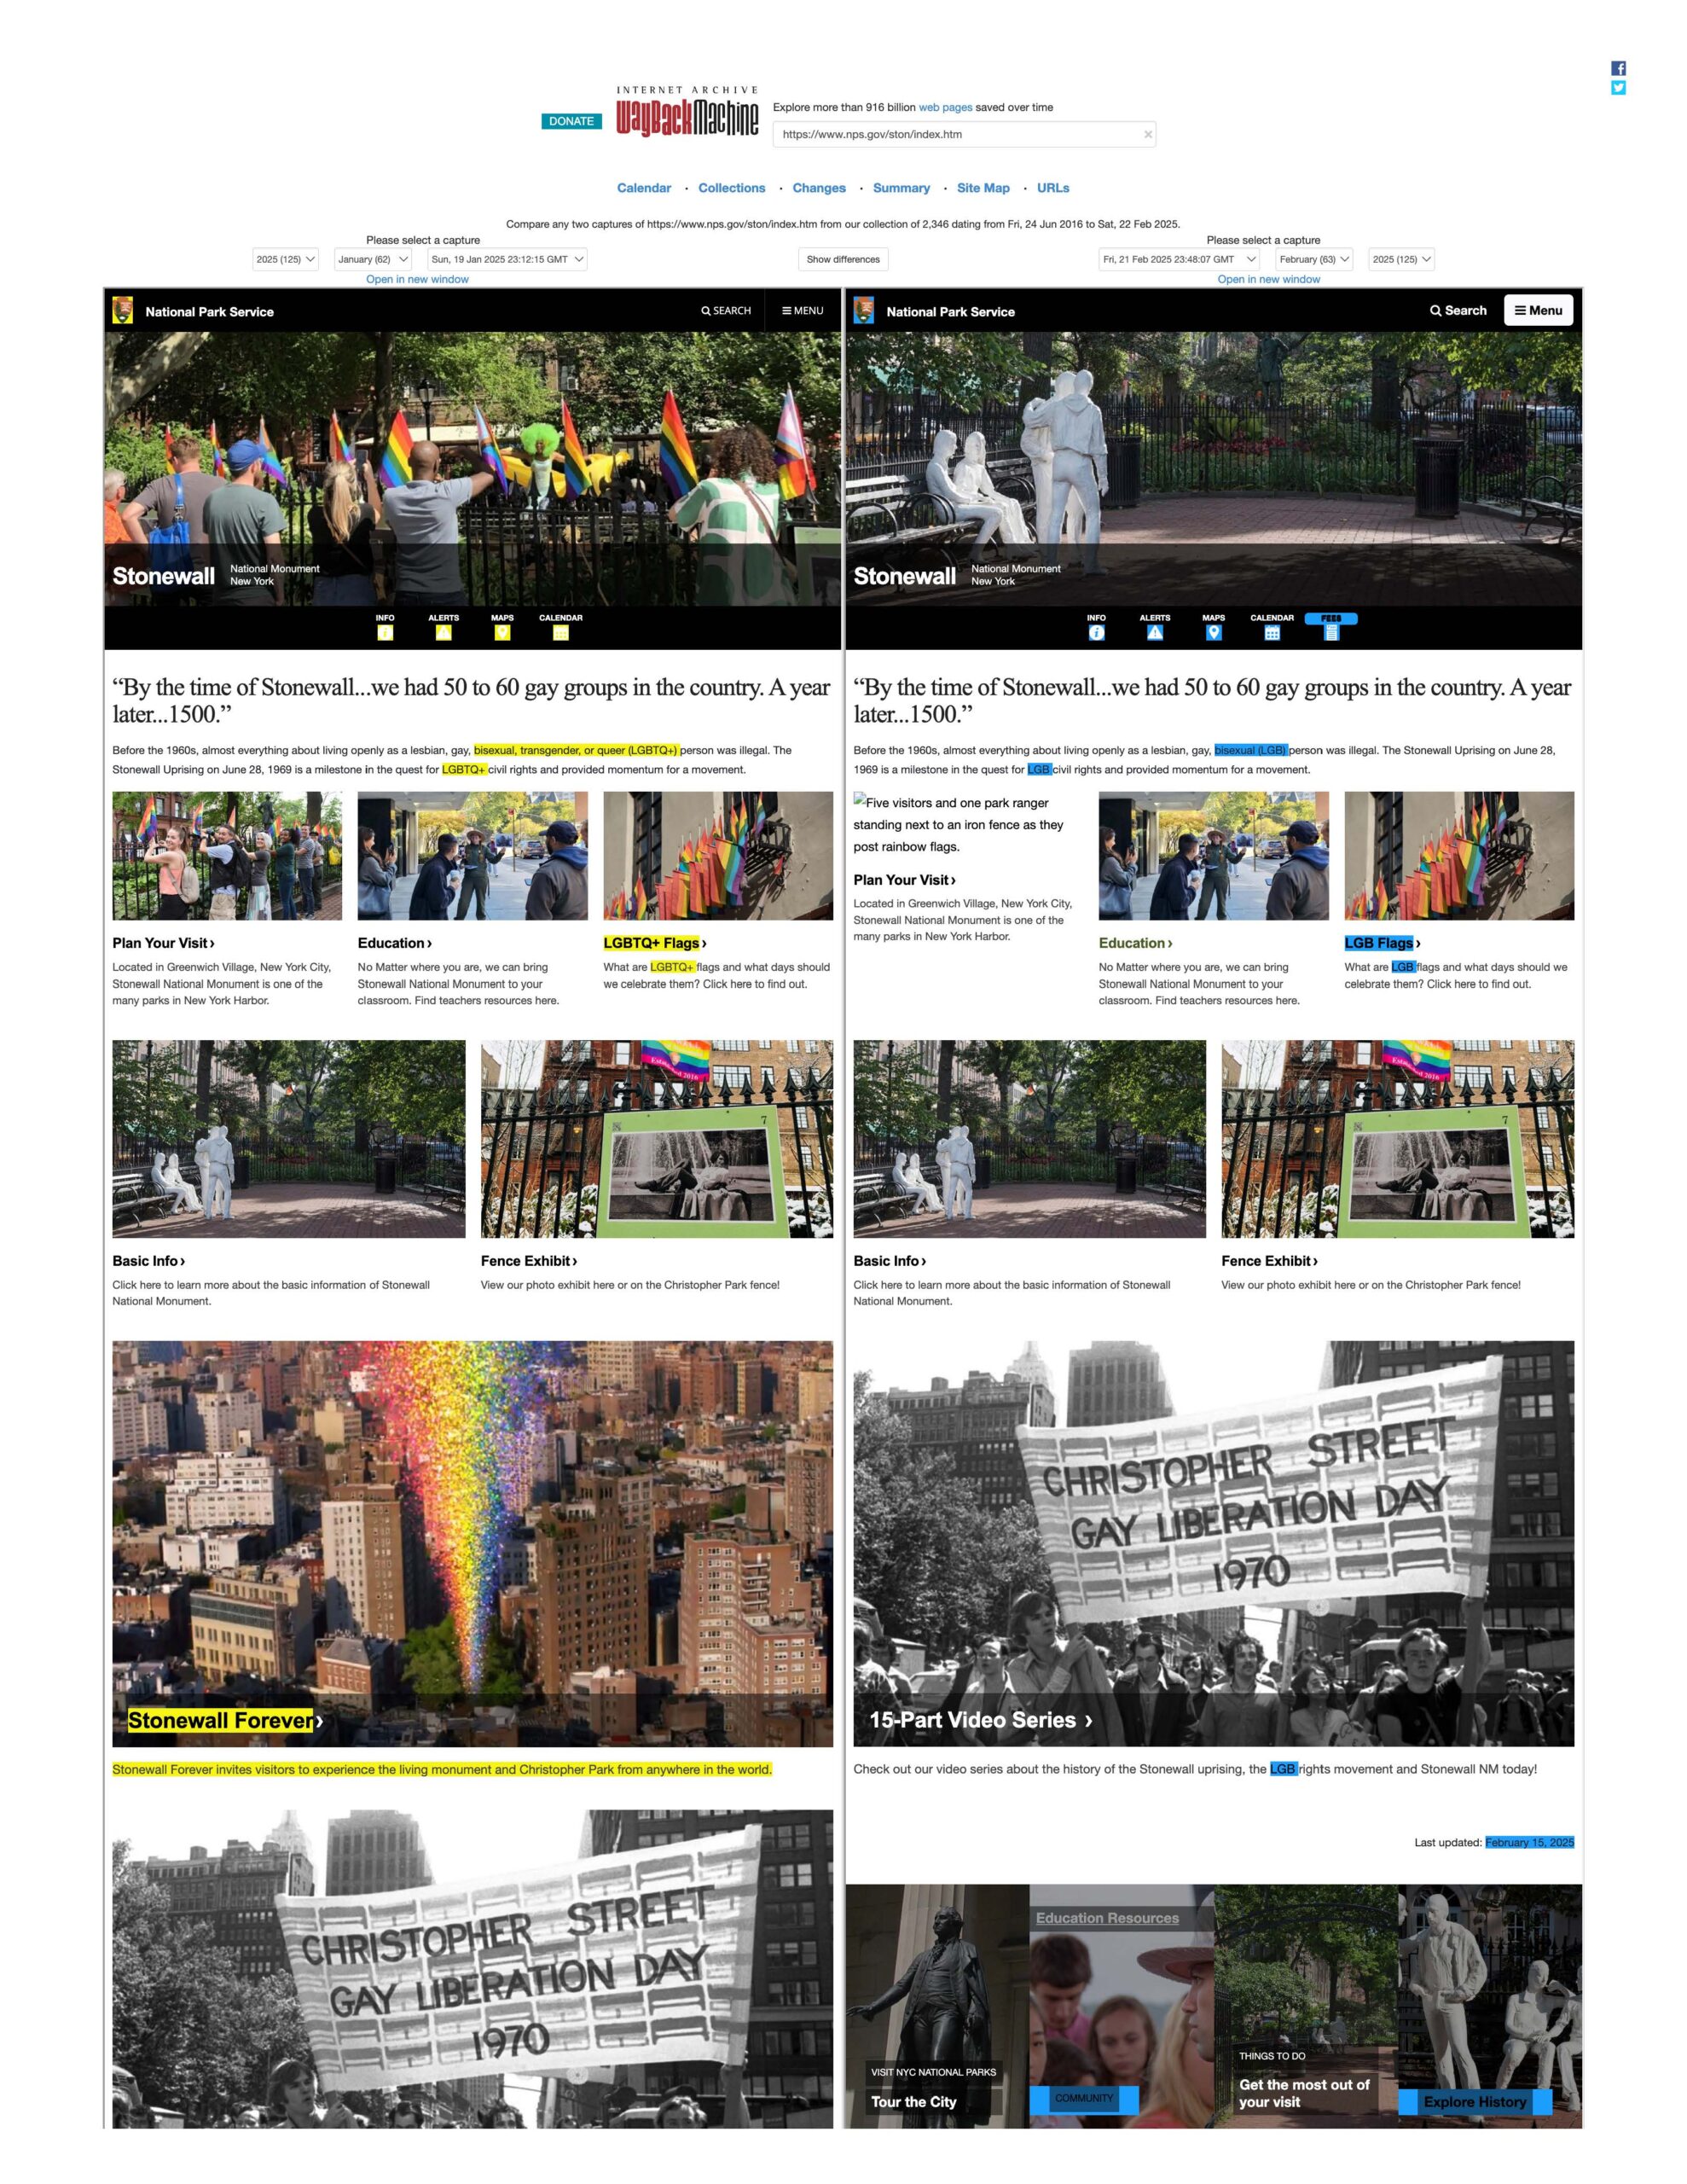
Two versions of the Stonewall National Monument website viewed through the Internet Archive Wayback Changes tool. Some items are highlighted due to the underlying code being changed, though the content remains the same.
My attempts to grapple with this reminded me of the “data visceralizations” of COVID deaths, such as Jacqueline Wernimont’s Memory Weaving (2022) or the National Covid Memorial Wall, both leveraging embodiment for an affective understanding of incomprehensible change (D’Ignazio & Klein 2020). The tactile representation in the tapestry, the experience of walking along the wall, and the visibility of the labor that went into these pieces is what makes them so effective.
I had an idea for turning these website revisions into a woven tapestry with students in a workshop setting to create an opportunity for discussion, exploration, and processing the erasure we are seeing. Turning the revisions into tapestry offers a way to represent changes beyond a binary diff—distinguishing between design, media, interactive elements, and text while also revealing major losses, such as deleted videos and resources.
As a teaching tool, this approach encourages close reading across text, media, and design. Students translate their analysis into structured data, make choices for physicalizing that data, and then craft a tapestry representing a portion of the site. While the Stonewall homepage presented rich material, I chose a different example for the workshop, being mindful of participants’ relationship to the material. We worked with the CDC’s About HIV page, which underwent significant revision before being partially restored after February 14th, 2025.
Lessons Learned
This workshop was my second attempt at teaching data physicalization. With both workshops, I was taken in by the deceptive simplicity of the tools—cardboard, yarn, scissors, pen, paper. What can go wrong?
From the generous feedback of colleagues who attended the first workshop, I learned that you cannot skip over discussing what data are and how they are made, as Miriam Posner discusses in “Humanities Data: A Necessary Contradiction” (2015). To grasp physicalization, it is helpful if participants practice and create a full piece, not merely translate a few data points, such as abstractly representing a couple lines of data in yarn. Working toward a completed piece helps to concretize the motivations behind data physicalization, understand what this kind of representation is hoping to achieve, and allow individuals to develop an argument around their own craft. Focusing on creating a piece also brings the artistry of data physicalization into the room which can get lost if you focus merely on the process of learning a craft and converting the data.
I am still seeking ways to simplify the craft and allow more space for discussion. This time, as I was standing in front of the room, attempting to weave with the board in front of me (you should practice this), I instructed people to do a twining stitch to secure their tapestry. This was a mistake. I had flashbacks to teaching python—the flash of errors across the room and frustrations. Weaving was easy for some people, but challenging for others who lacked experience and dexterity. It was a reminder that crafts, like coding, are also complex technologies. Even in an analog setting, workshops can replicate the same pedagogical challenges as digital tools—varying skill levels, uneven comfort with technology, and the three-speed problem. I had turned to craft to avoid buttonology, aiming for a low-tech approach as Walsh proposed, but crafting workshops, too, risk becoming rote technical instruction rather than spaces for critical engagement. The more intricate the technique, the more likely the instructor-student dynamic mirrors Freire’s banking model of education (2000).
This is not to say that the workshop was a failure or that crafting workshops should be avoided, but that they are not inherently “low-tech” in the same way that Walsh and Sayers are working, simply by the virtue of being non-digital. This workshop was more successful at teaching data physicalization as a decision-making process, but successfully completing a craft does take time away from critical discussion. Moving forward, I hope to refine the balance between making and meaning—ensuring that technical instruction supports, rather than overshadows, the inquiry at the heart of the workshop.
Workshop Design and Materials
This workshop seeks to meet the needs of a mixed classroom, where some learners may have advanced knowledge of how to work with the data or the craft and some may have no experience at all. Ideally, schedule 90 minutes to allow for an introduction to frame the workshop followed by time to do the craft. Leave 10-15 minutes at the end for people to share their process and reflect.
This workshop focuses on the affective impact of physicalization on data representation and the process of translating data into representation in a tapestry, which may be more interpretive than other visualization processes familiar to learners. The concept of affective data is introduced at the beginning of the workshop with a brief presentation and discussion on data feminism (D’Ignazio & Klein 2020) and examples of woven data.
Learning Outcomes
- Examine the impact of physicalization on data representation
- Read and construct tabular data
- Perform a close reading of two versions of a text
- Develop a method for representing changes in text in tapestry
Supplies and Preparation
- Cardboard
- Cardstock, cut in strips
- Scissors
- Warp string
- Yarn or fabric, variety of textures, weight; pre-cut for students
- Popsicle sticks
- Yarn needle
- Darning needles (optional)
You don’t need a lot of supplies to run this workshop, including looms—DIY cardboard looms work well. When selecting yarn, vary texture and weight rather than relying solely on color. Instead of offering a full-color spectrum, provide a curated selection of complementary shades, including neutrals.
Any yarn weight will work, but note that while thicker weight yarns will build a project faster, very chunky yarn will make a project somewhat messy. In the example in these instructions, which comes from the workshop, the large contrast in yarn weight, the very heavy yarn, and the narrowness of the tapestry led to the piece being slightly unstable and wonky. Correcting for these would make a more even tapestry.
If working with a large group, pre-cutting materials helps streamline the process.
Tapestry Step-by-step
Step 1: Choosing a Document
To make this tapestry, begin by choosing a document that has two versions. This example uses the Internet Archive Wayback Changes tool, but it could also be a manuscript revision (e.g., The “Yellow Wallpaper” digital edition), edits in a GitHub repository, or changes to a Wikipedia page.
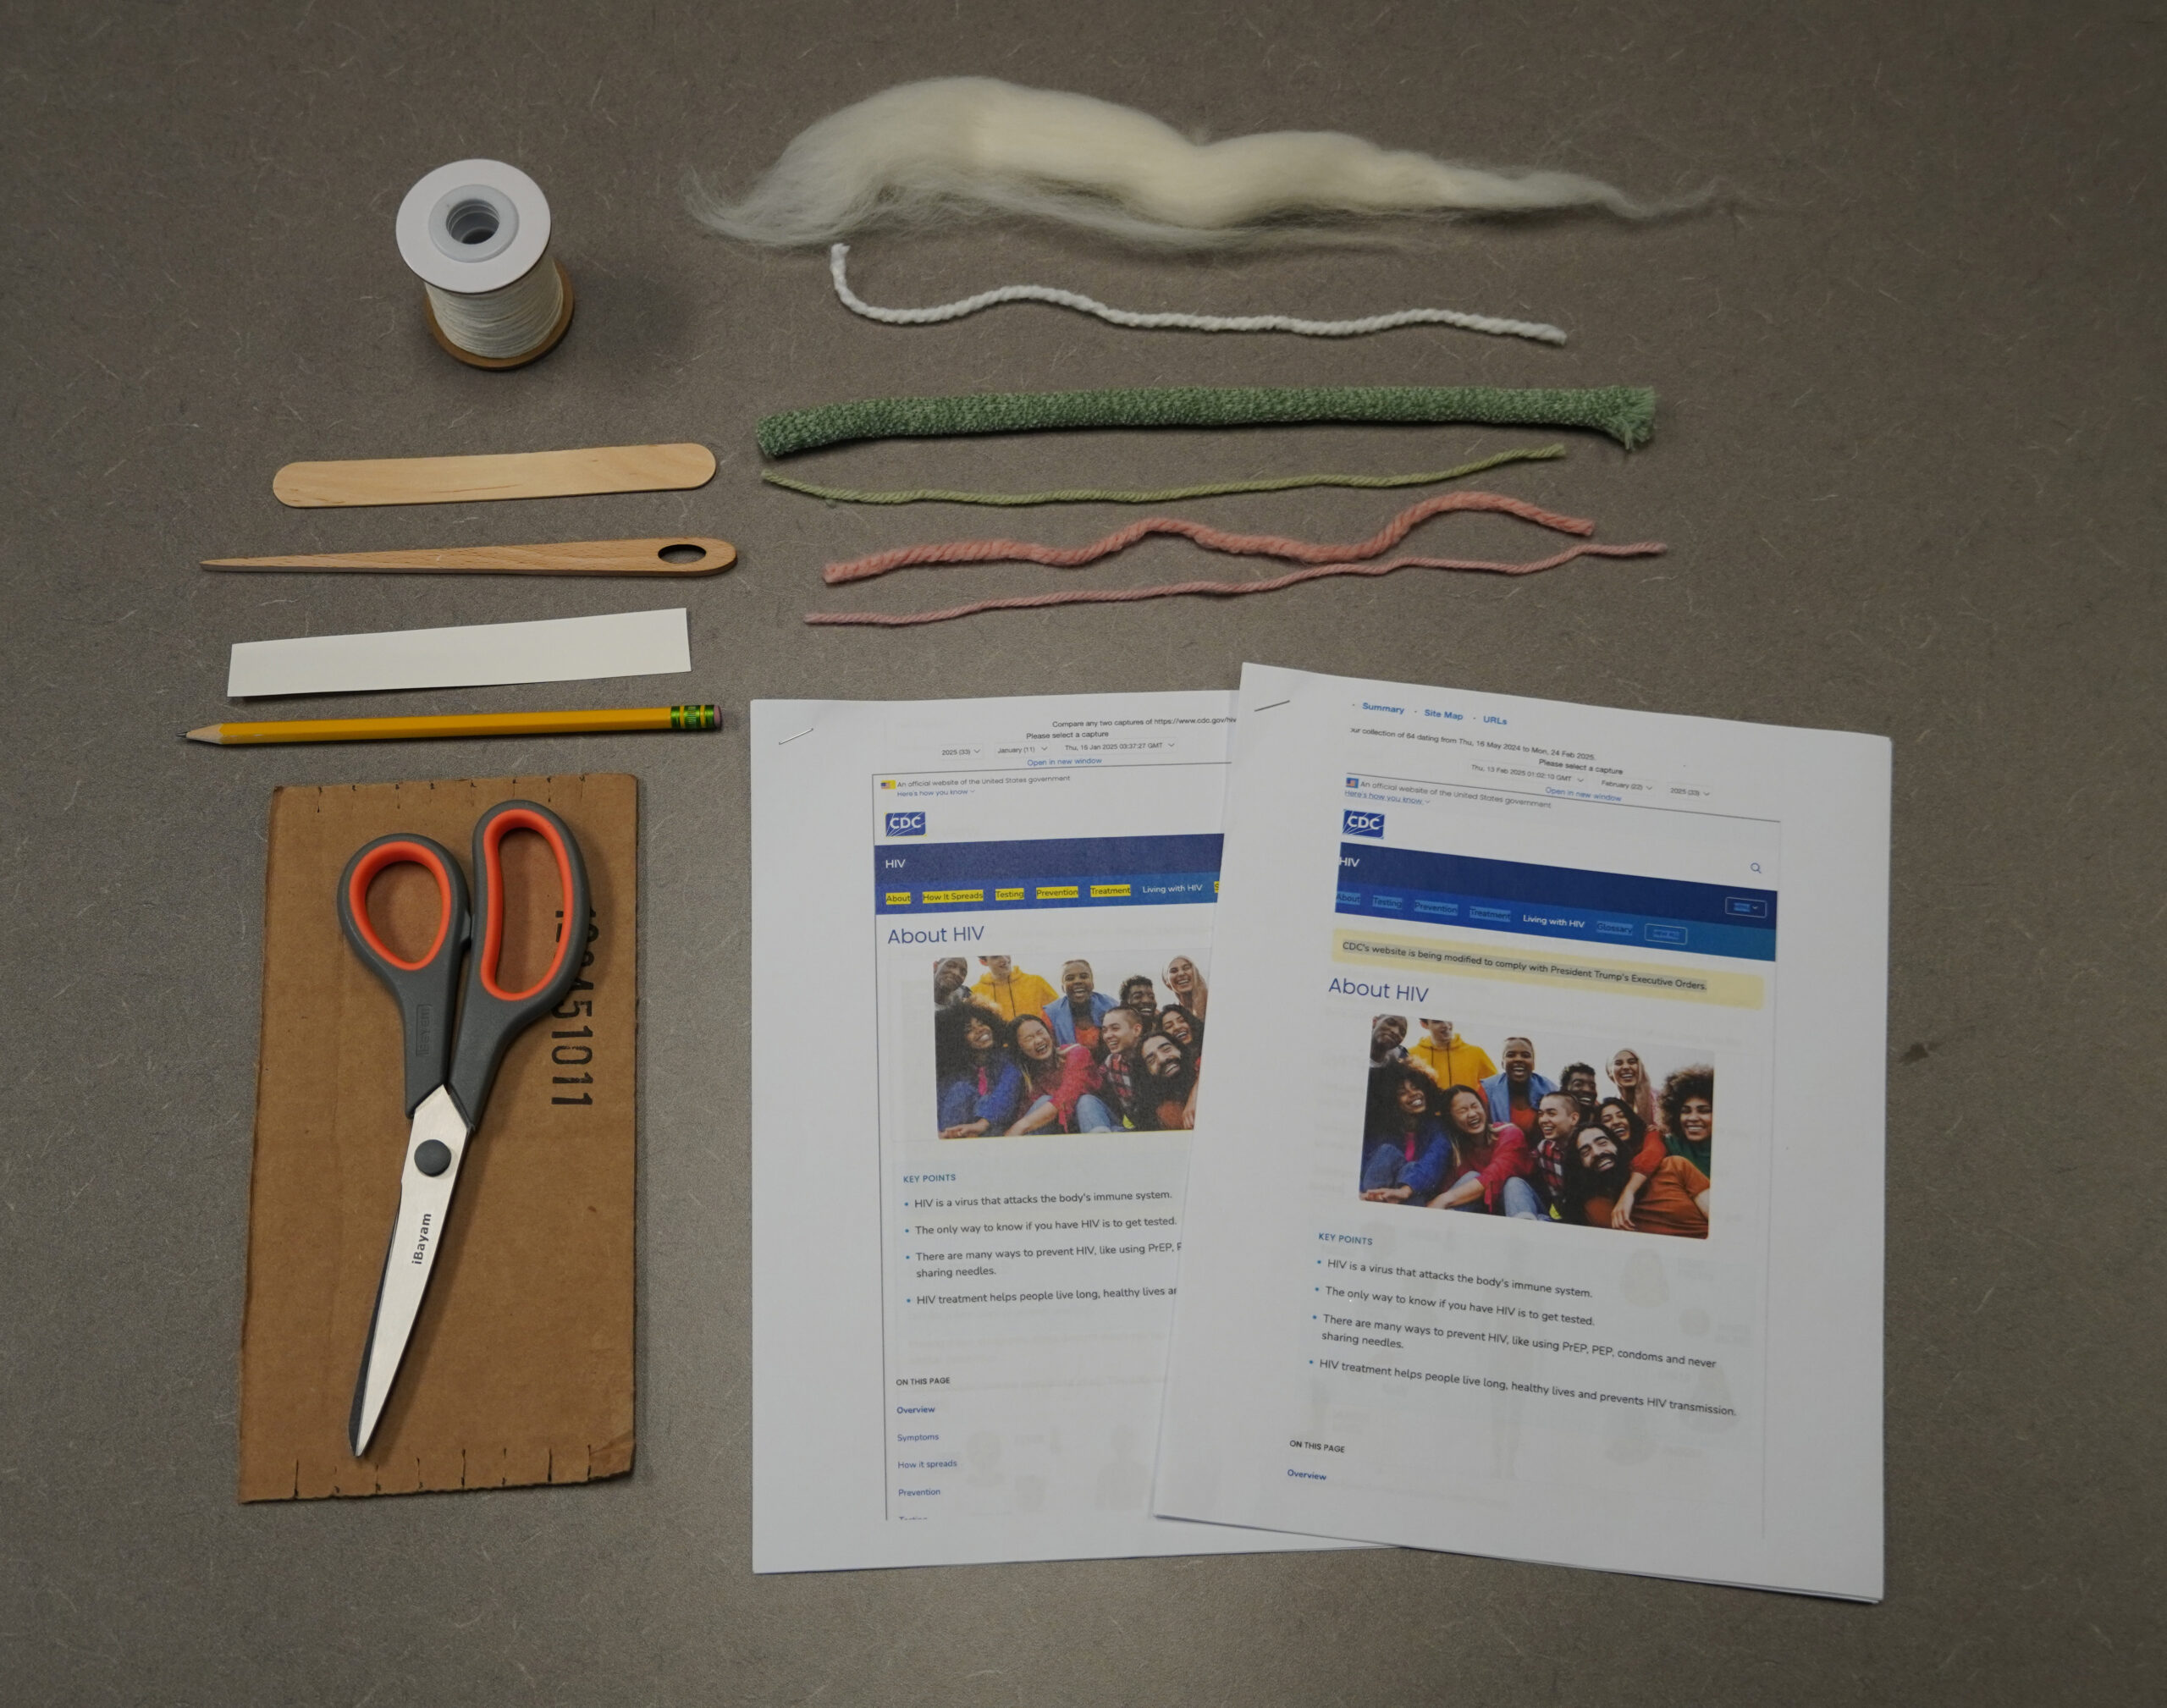
I recommend making physical, printed copies of the documents you are comparing. For efficiency, print versions with diffs visible.
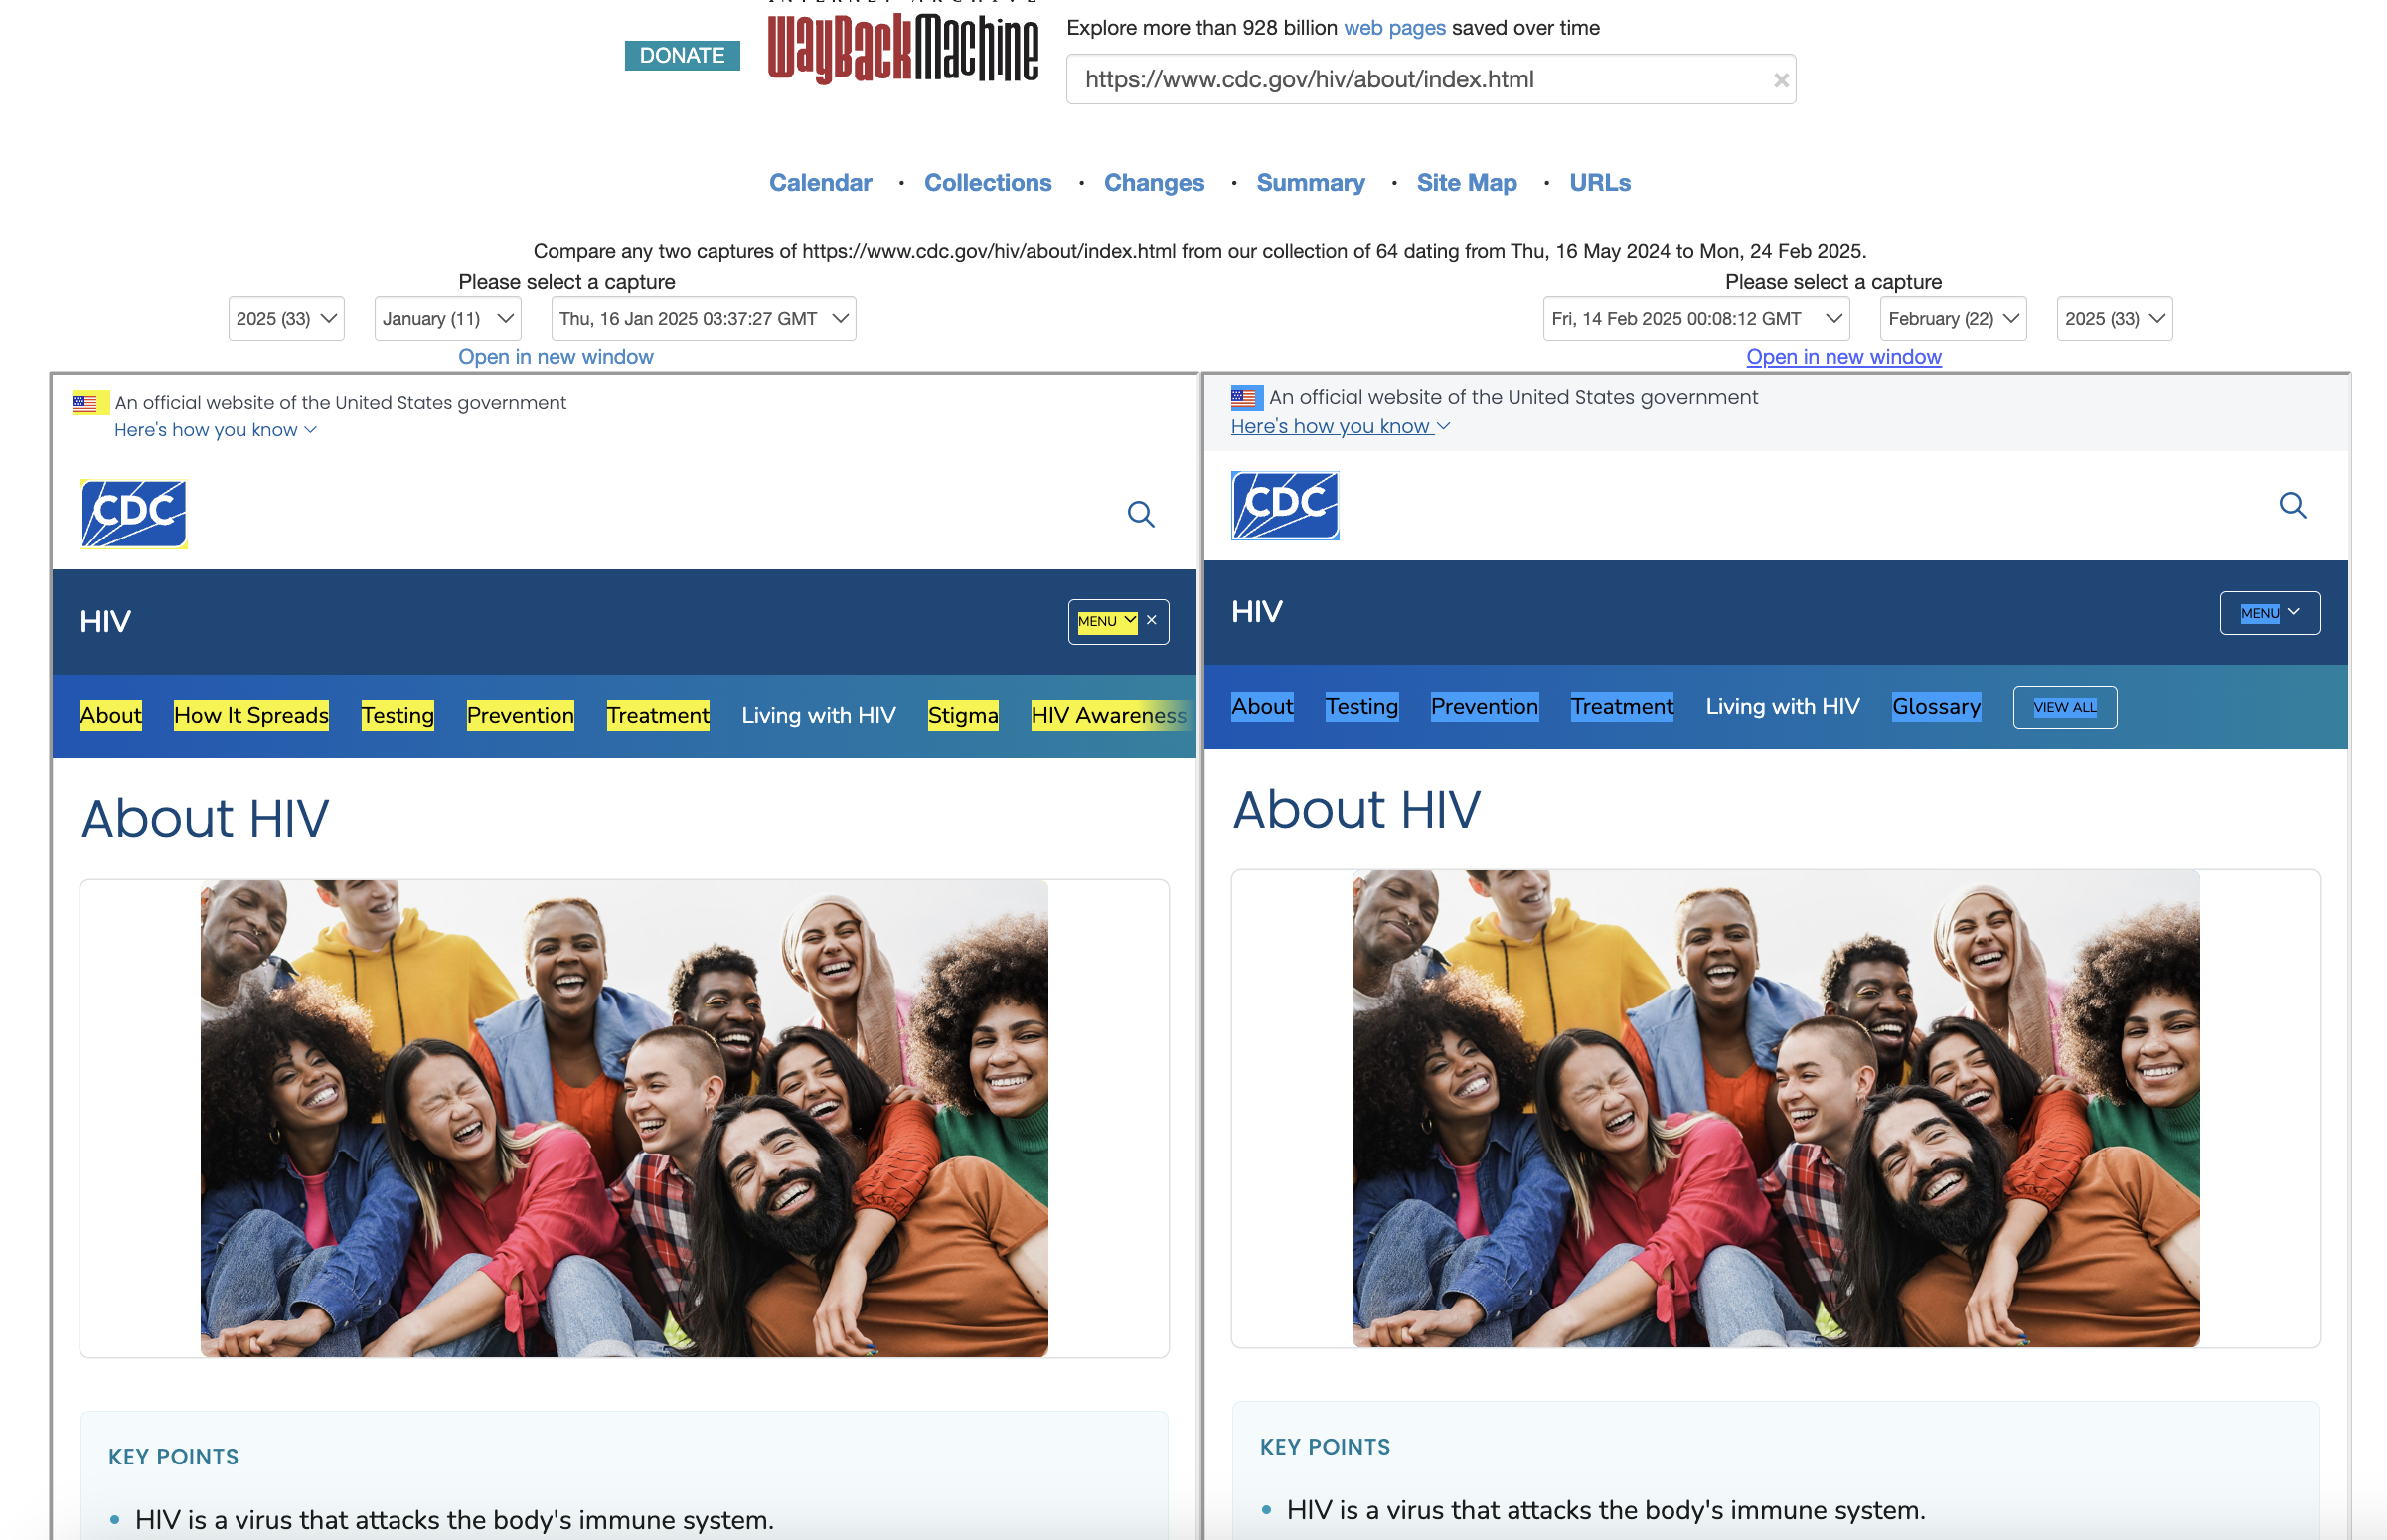
Two versions of the CDC webpage about HIV viewed through the Internet Archive Wayback Changes tool. Some changes highlighted are differences in code at the back end rather than changes to the content, but starting at the navigation bar, it is evident that some content has been removed, such as pages for “How it Spreads,” “Stigma,” and “HIV Awareness.”
Step 2: Annotating Changes
Mark insertions, deletions, and modifications in the text. Consider changes in different media types—text, links, images, or design elements. With the CDC HIV example, a missing link often signals the removal of an entire page of information.
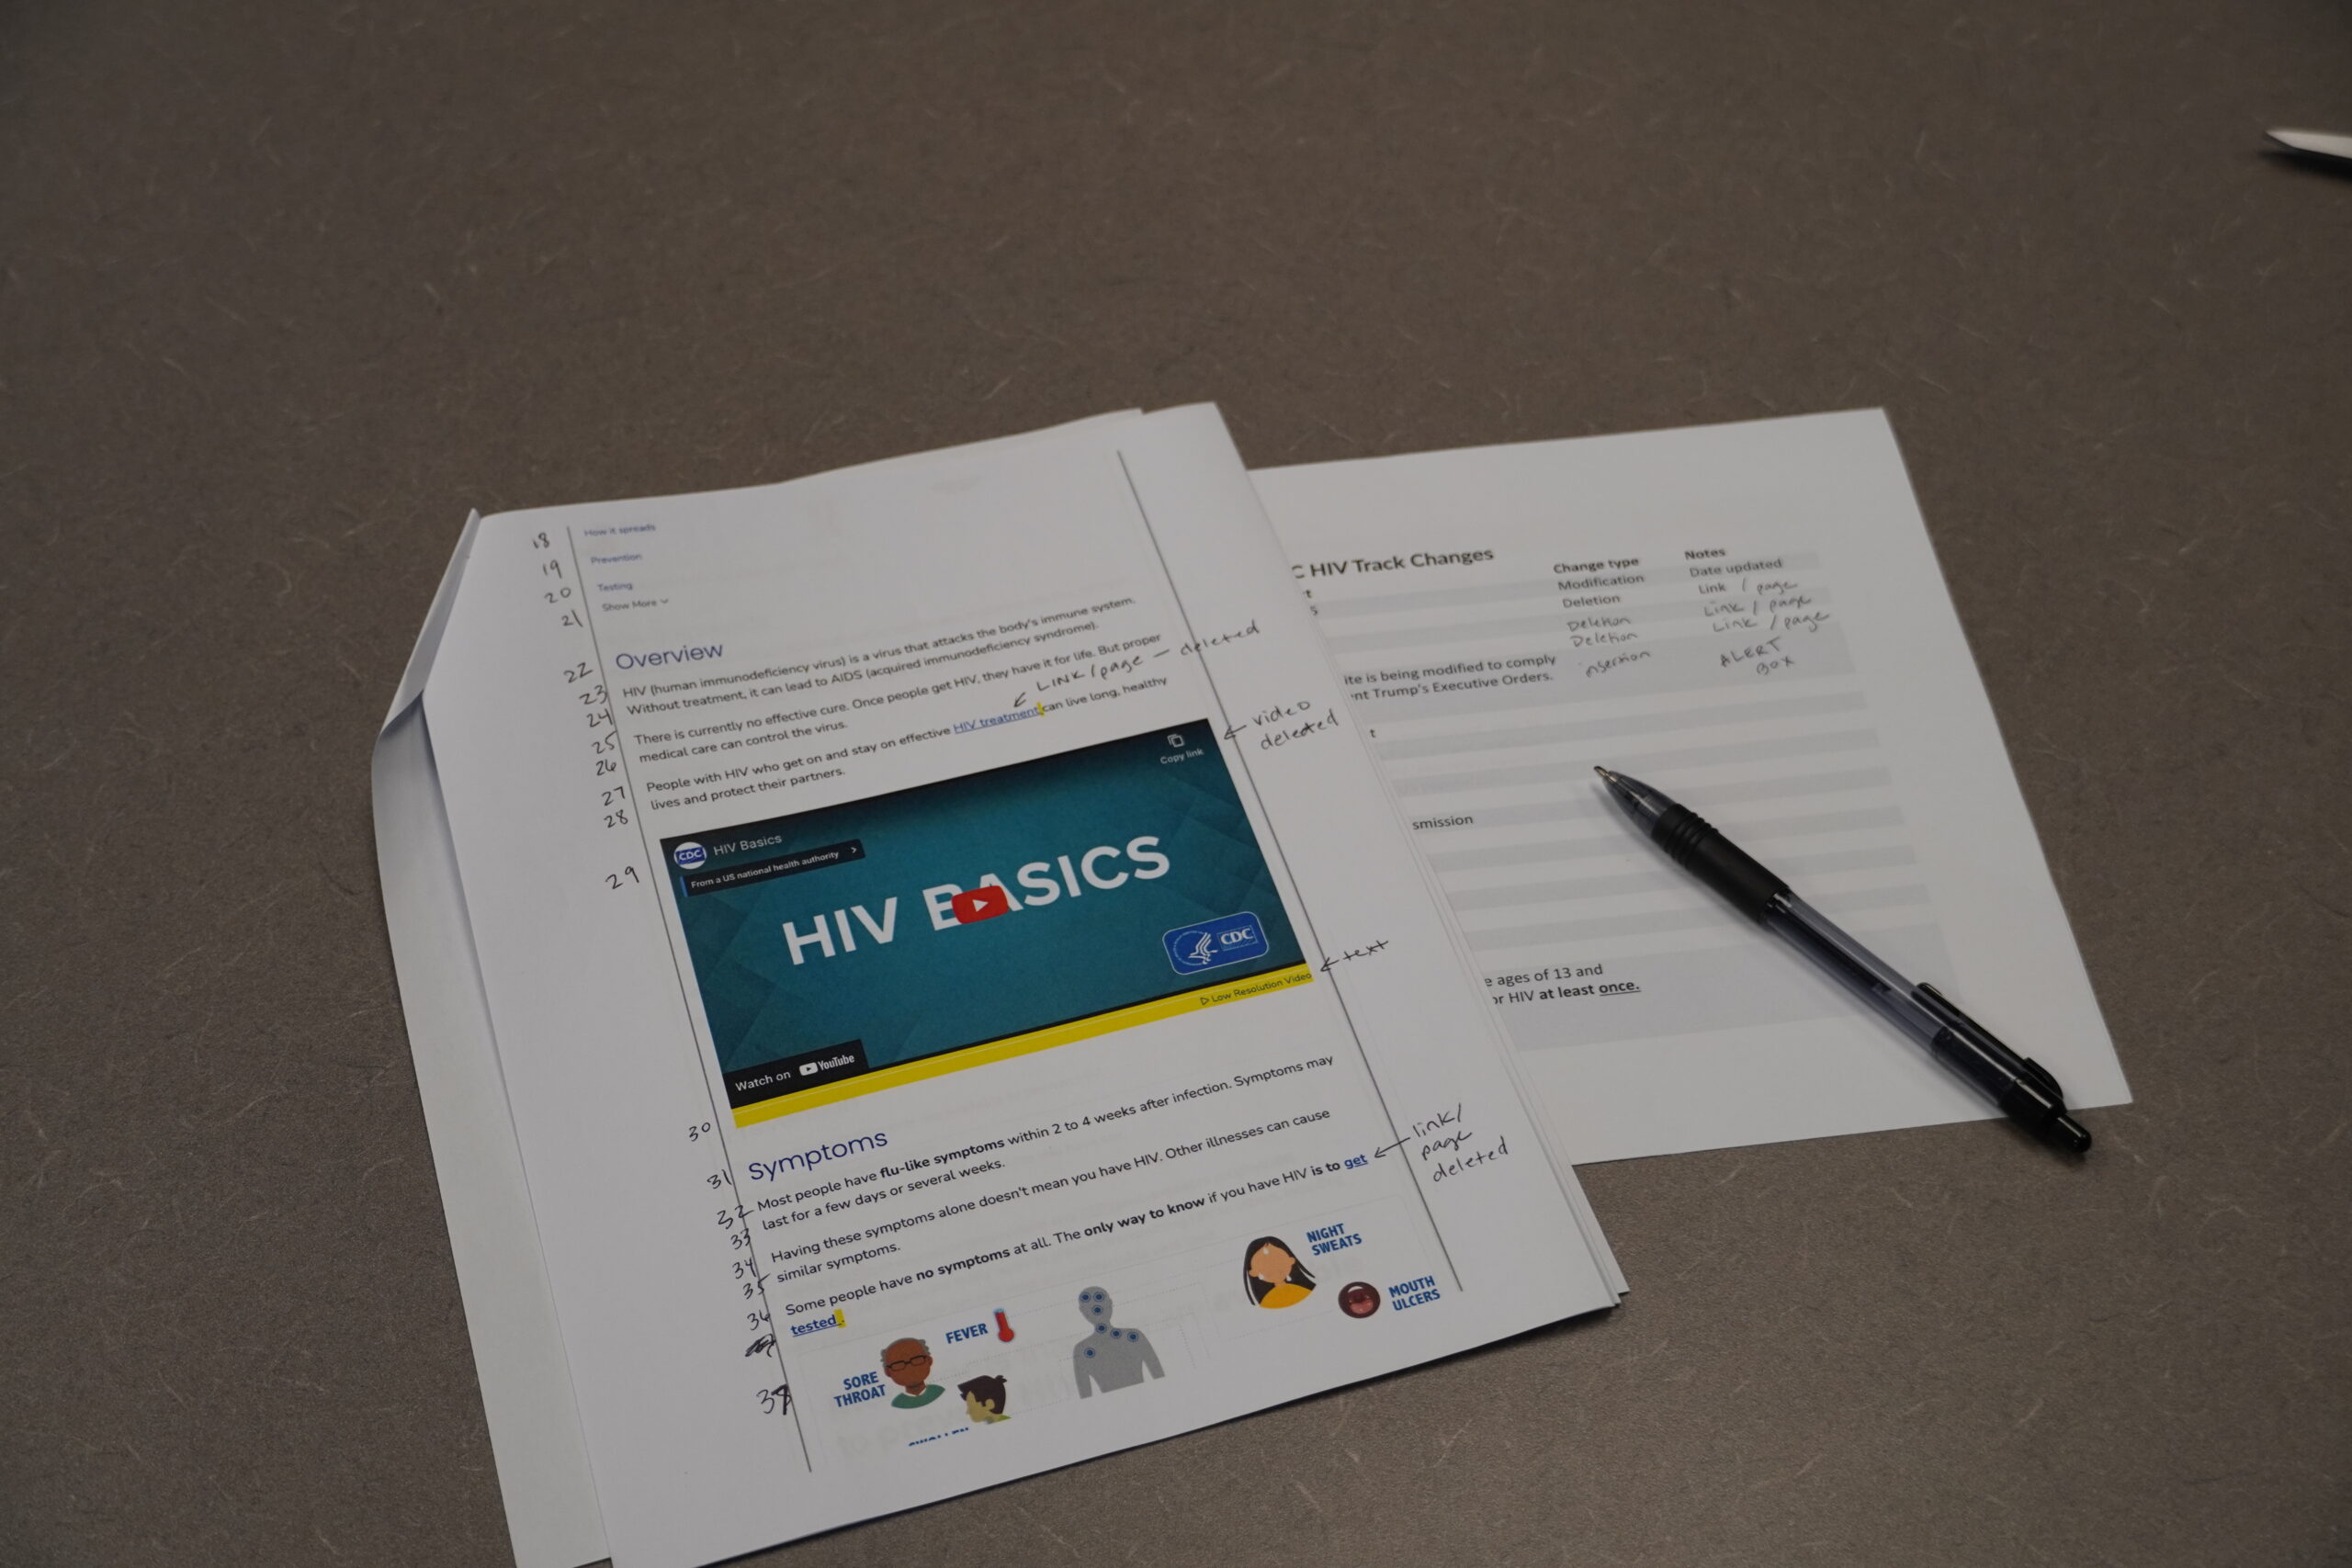
The diff checker missed a few changes and failed to capture some of the features I wanted to represent. I annotated deletions, insertions, and modifications, noting media, links, alert boxes, and alterations to design. In this example, I tracked line numbers by hand. In the workshop, I provided a table of the diffs with empty spaces for filling in the types and notes to model a method for converting these observations into structured data.

The table, which was printed out, had two completed rows to provide an example for attendees. In the short timeframe of a workshop, this provides clarity and helps people build their tabular dataset.
Step 3: Organize your data
Create a table with columns for:
- The changed content
- The type of change (insertion, deletion, modification)
- Any qualities you want to represent in the tapestry
Each row will correspond to a section of woven data.
Step 4: Planning the Physicalization
Decide how you would like to represent these changes on a tapestry and select your materials for the physicalization.
Will you show only changes, or also the unchanged content for context and contrast? If most of the document remains the same, representing unchanged content may not be useful.
For the workshop, I created two patterns as options: one focusing solely on changes, another including the full diff. I used word count, but line count may provide a clearer structure and help learners draw the connection from method to physicalization.
Color choices: I selected cream, blush pink, and sage green, incorporating varied textures like sage cord and undyed wool roving. I inverted the common “green for new, red for old” convention, avoiding the implication that “green” always signifies positive change. Thick sage cord represented removed links and media, emphasizing their weight.
Step 5: Making the Loom
Set up the loom. DIY cardboard looms work well, but should be pre-set for a workshop. Small, even cuts along the cardboard create space nestle the warp string. Some loom tutorials cut and glue horizontal strips of cardboard which make the weaving easier, but are more time consuming to make for a whole class.
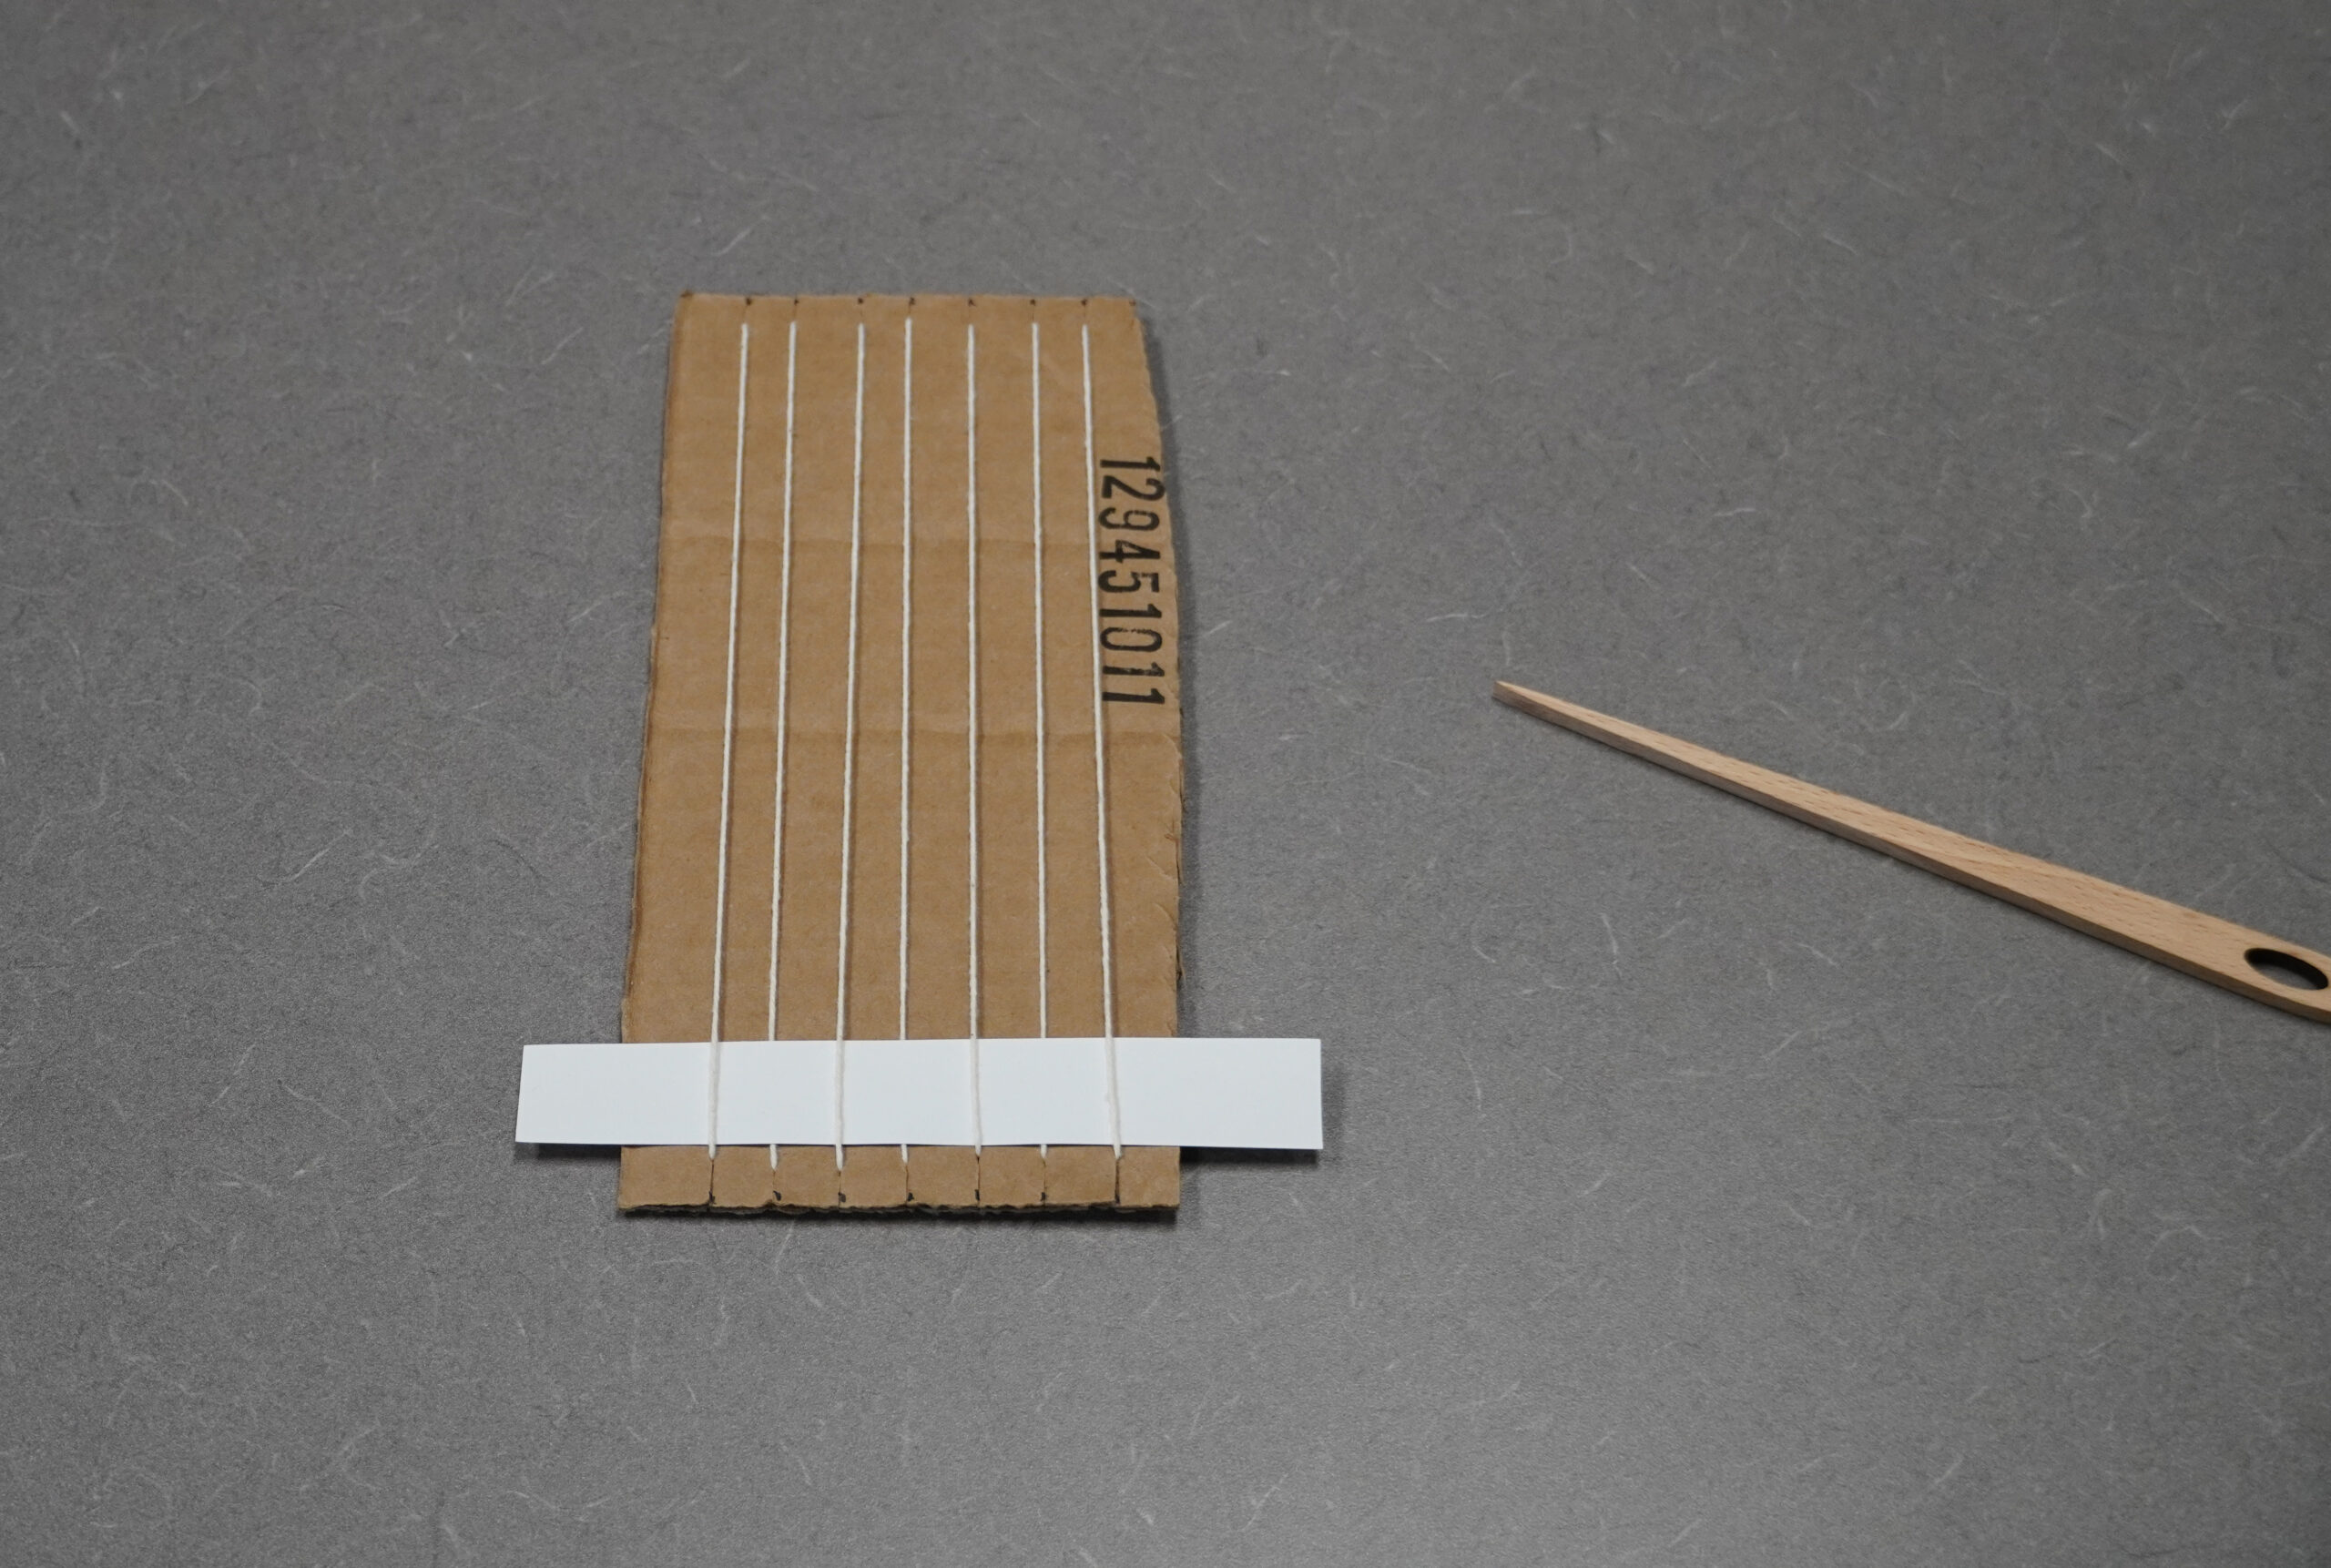
Nestle the warp string into the first notch in the cardboard, leaving a 3-4” tail. Pull the string all the way down the loom and nestle into the corresponding notch at the bottom.
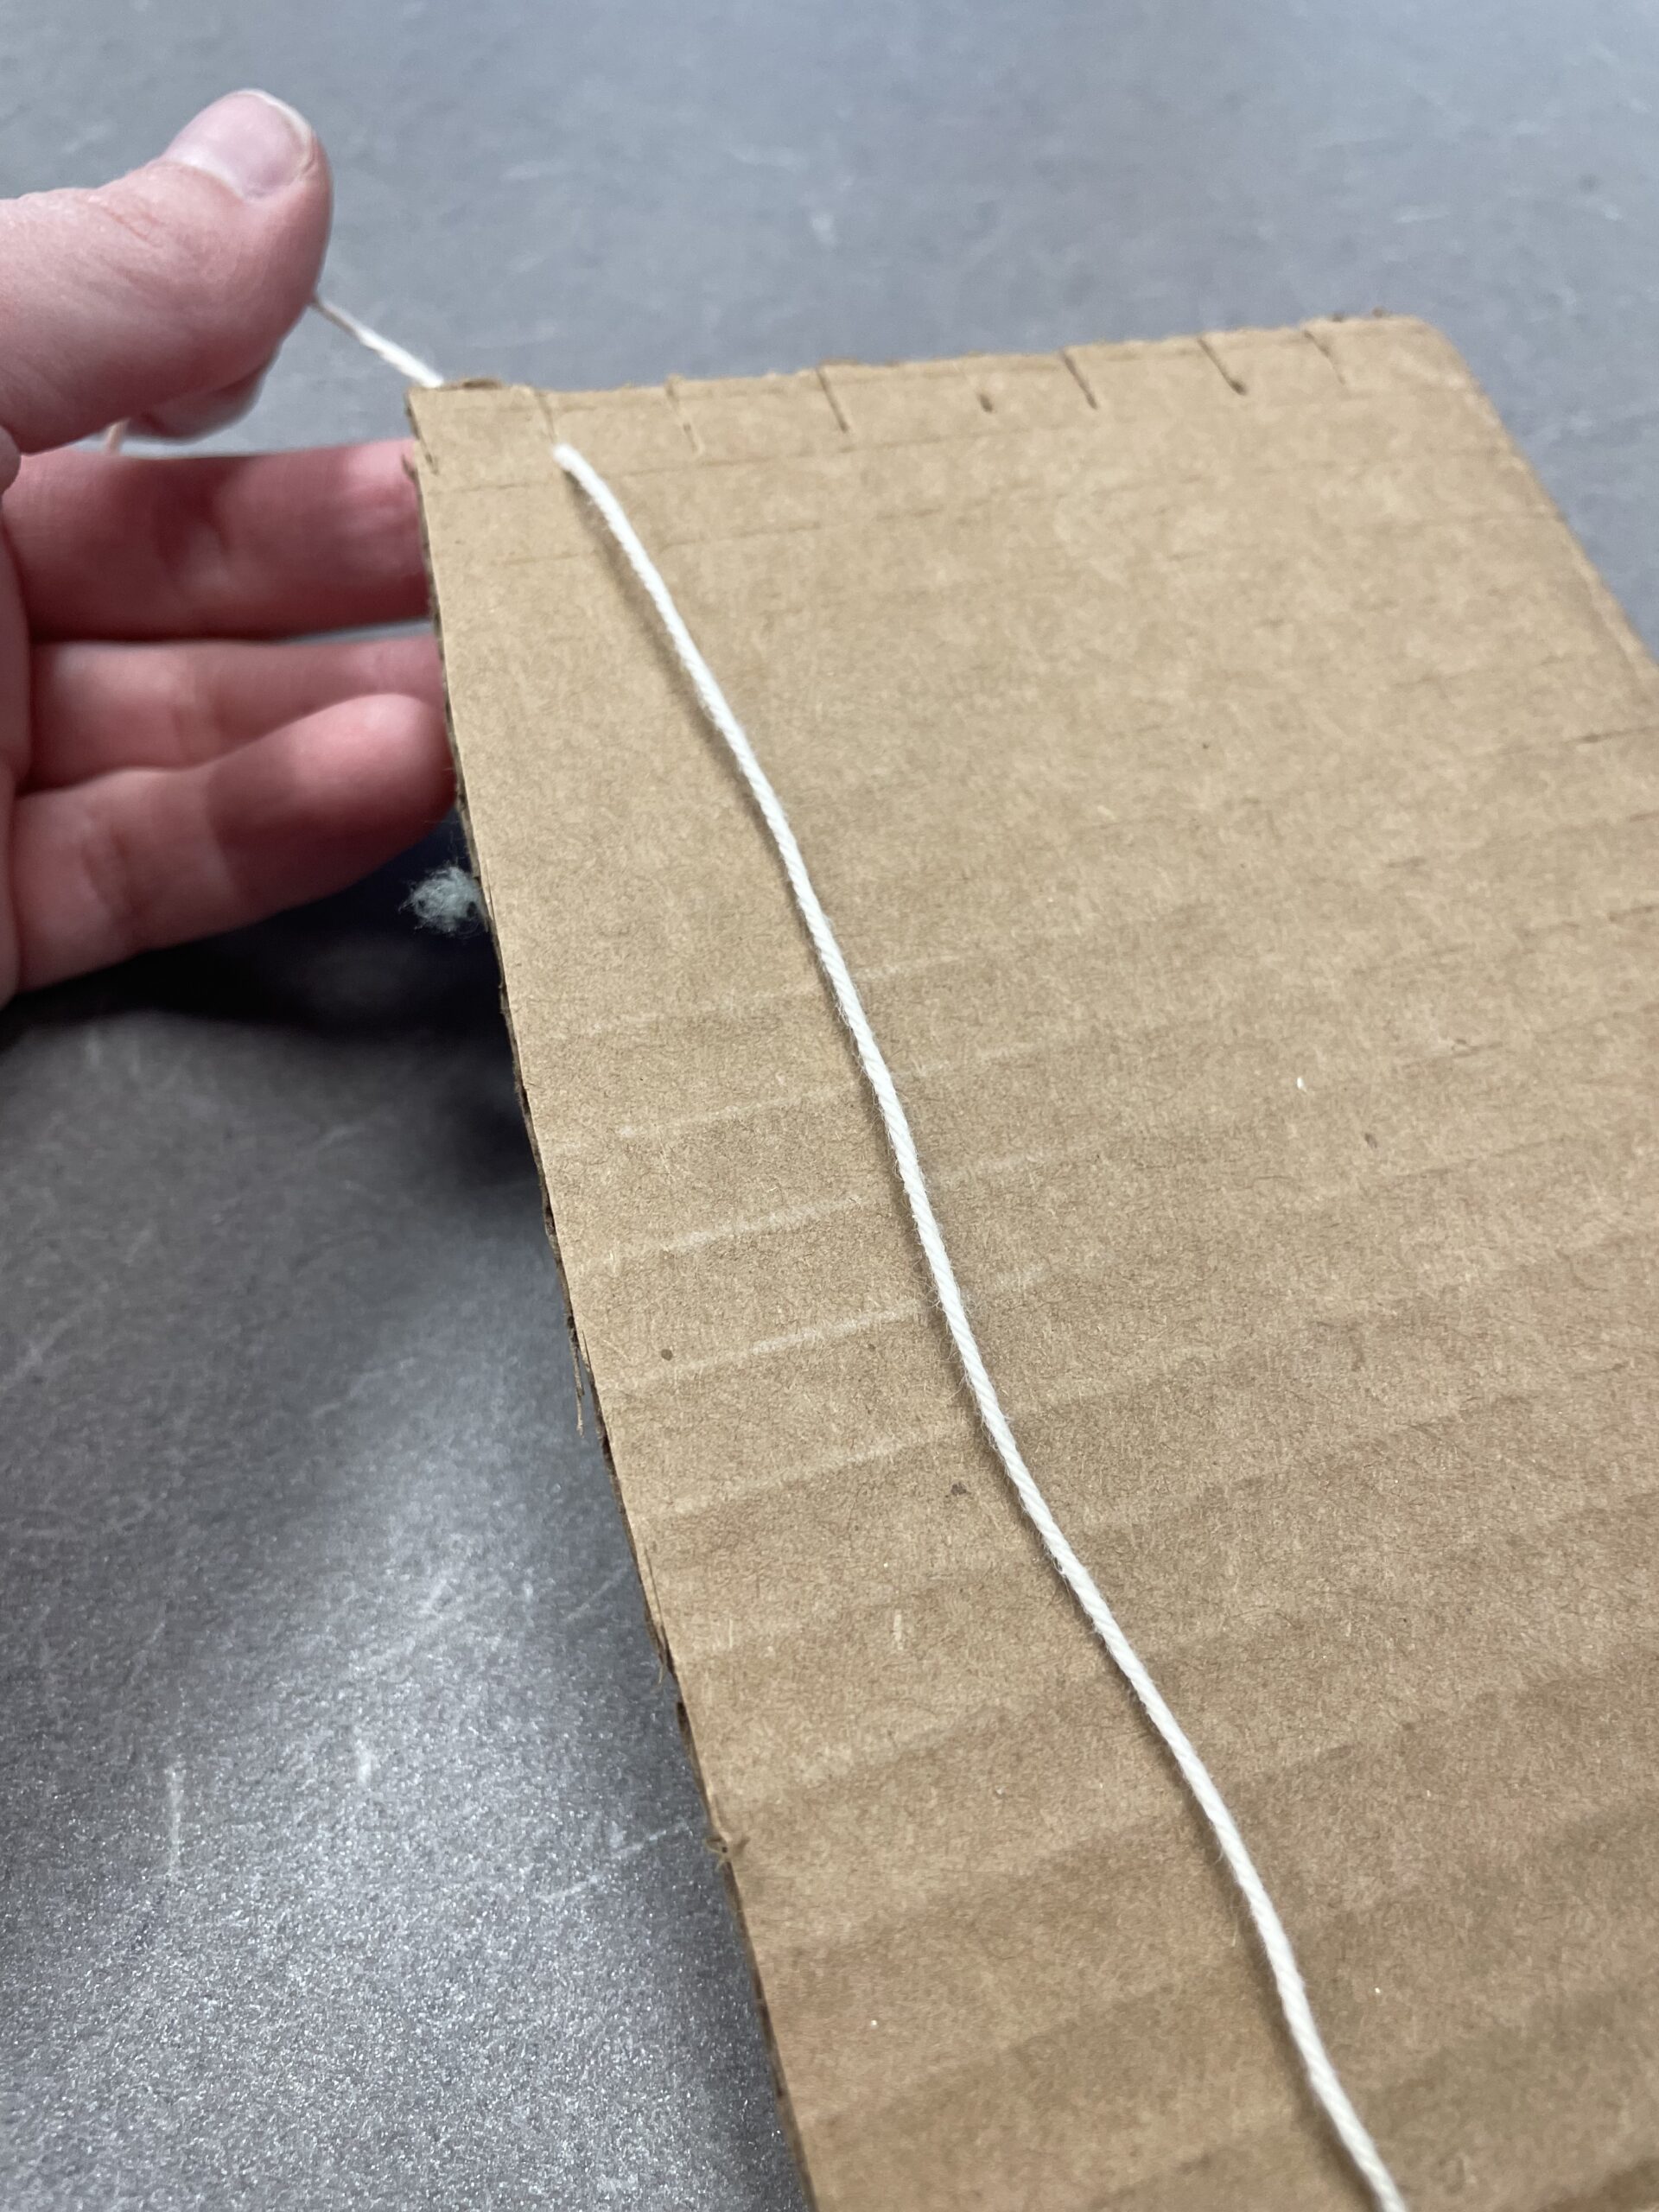
The string is nestled into the first notch. Make the cuts even as possible both in terms of their distance from one another and depth in the cardboard.
To make your way back up the loom, do not take the warp string up the length of the reverse side. Instead, from behind the loom, pull the string sideways and through the next notch to the front. Now you can pull the string back up to the top.
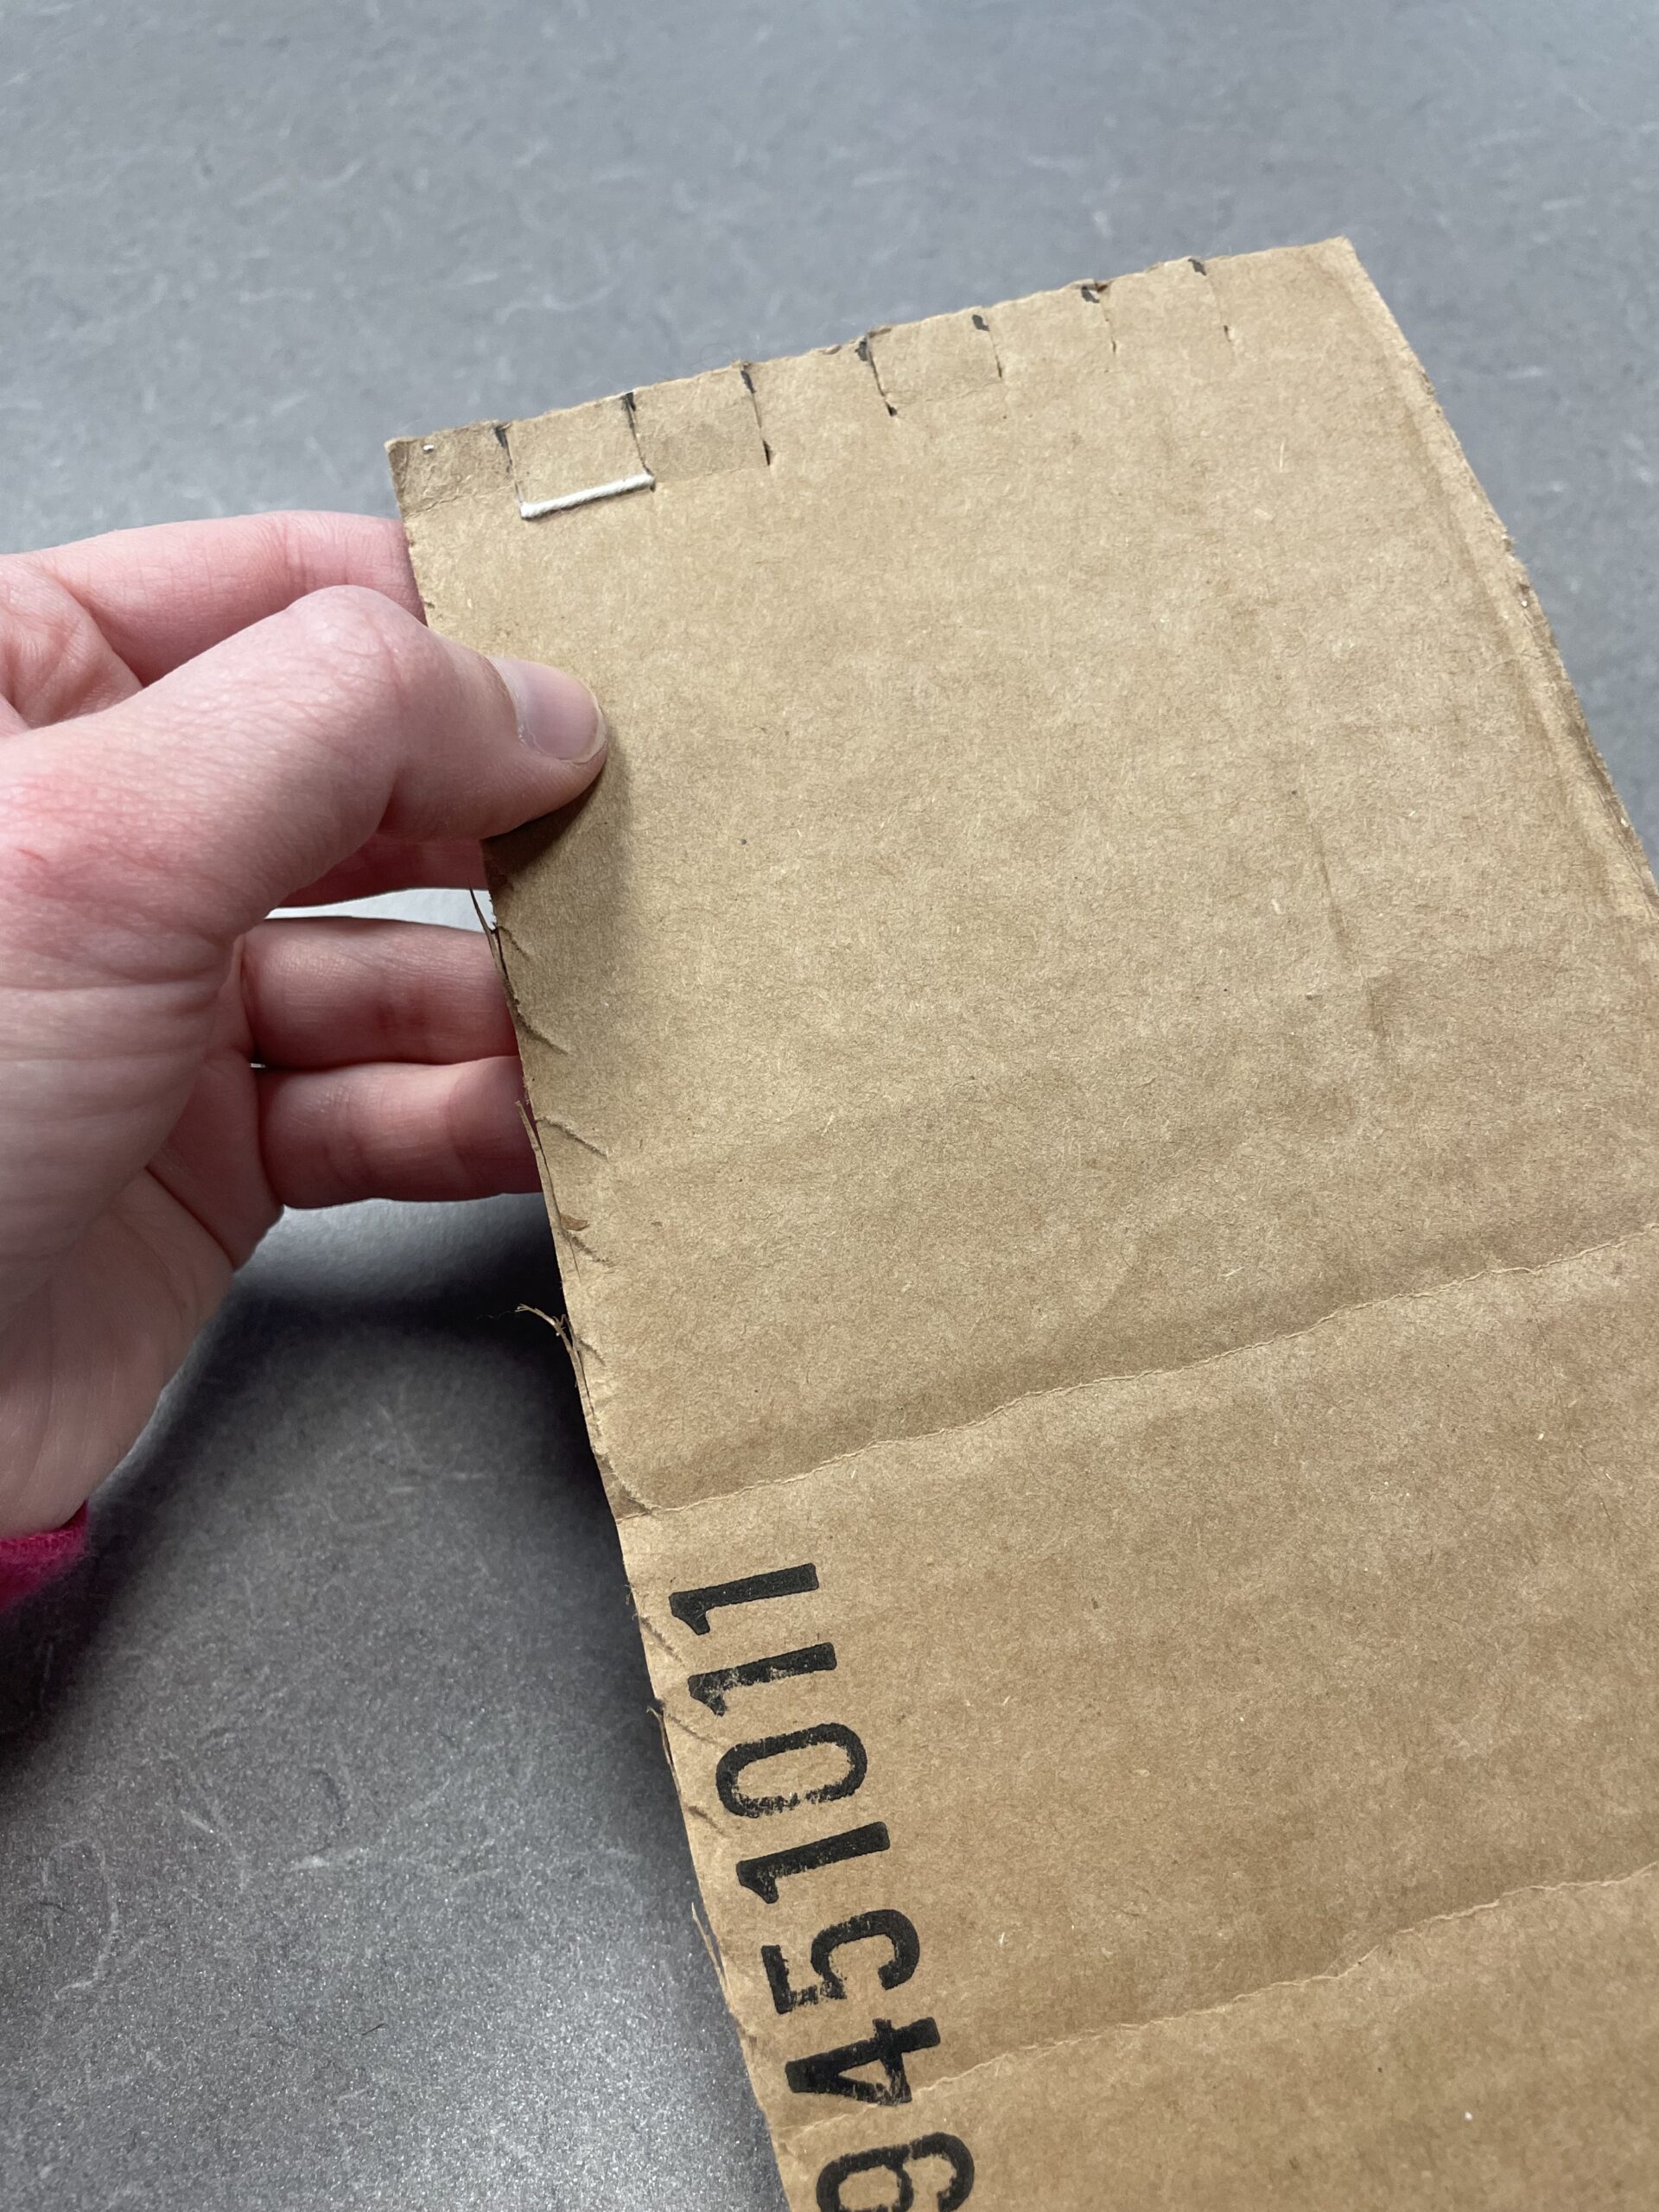
The warp string pulled tight across the back and through the next notch to the front.
Repeat this process of pulling the string down, behind, through to the front, and back to the top until you have enough warp to work with. For the tapestry, I have made it a little tall and narrow. The start and end of the loom should be on the same side and oriented to the bottom of your tapestry.
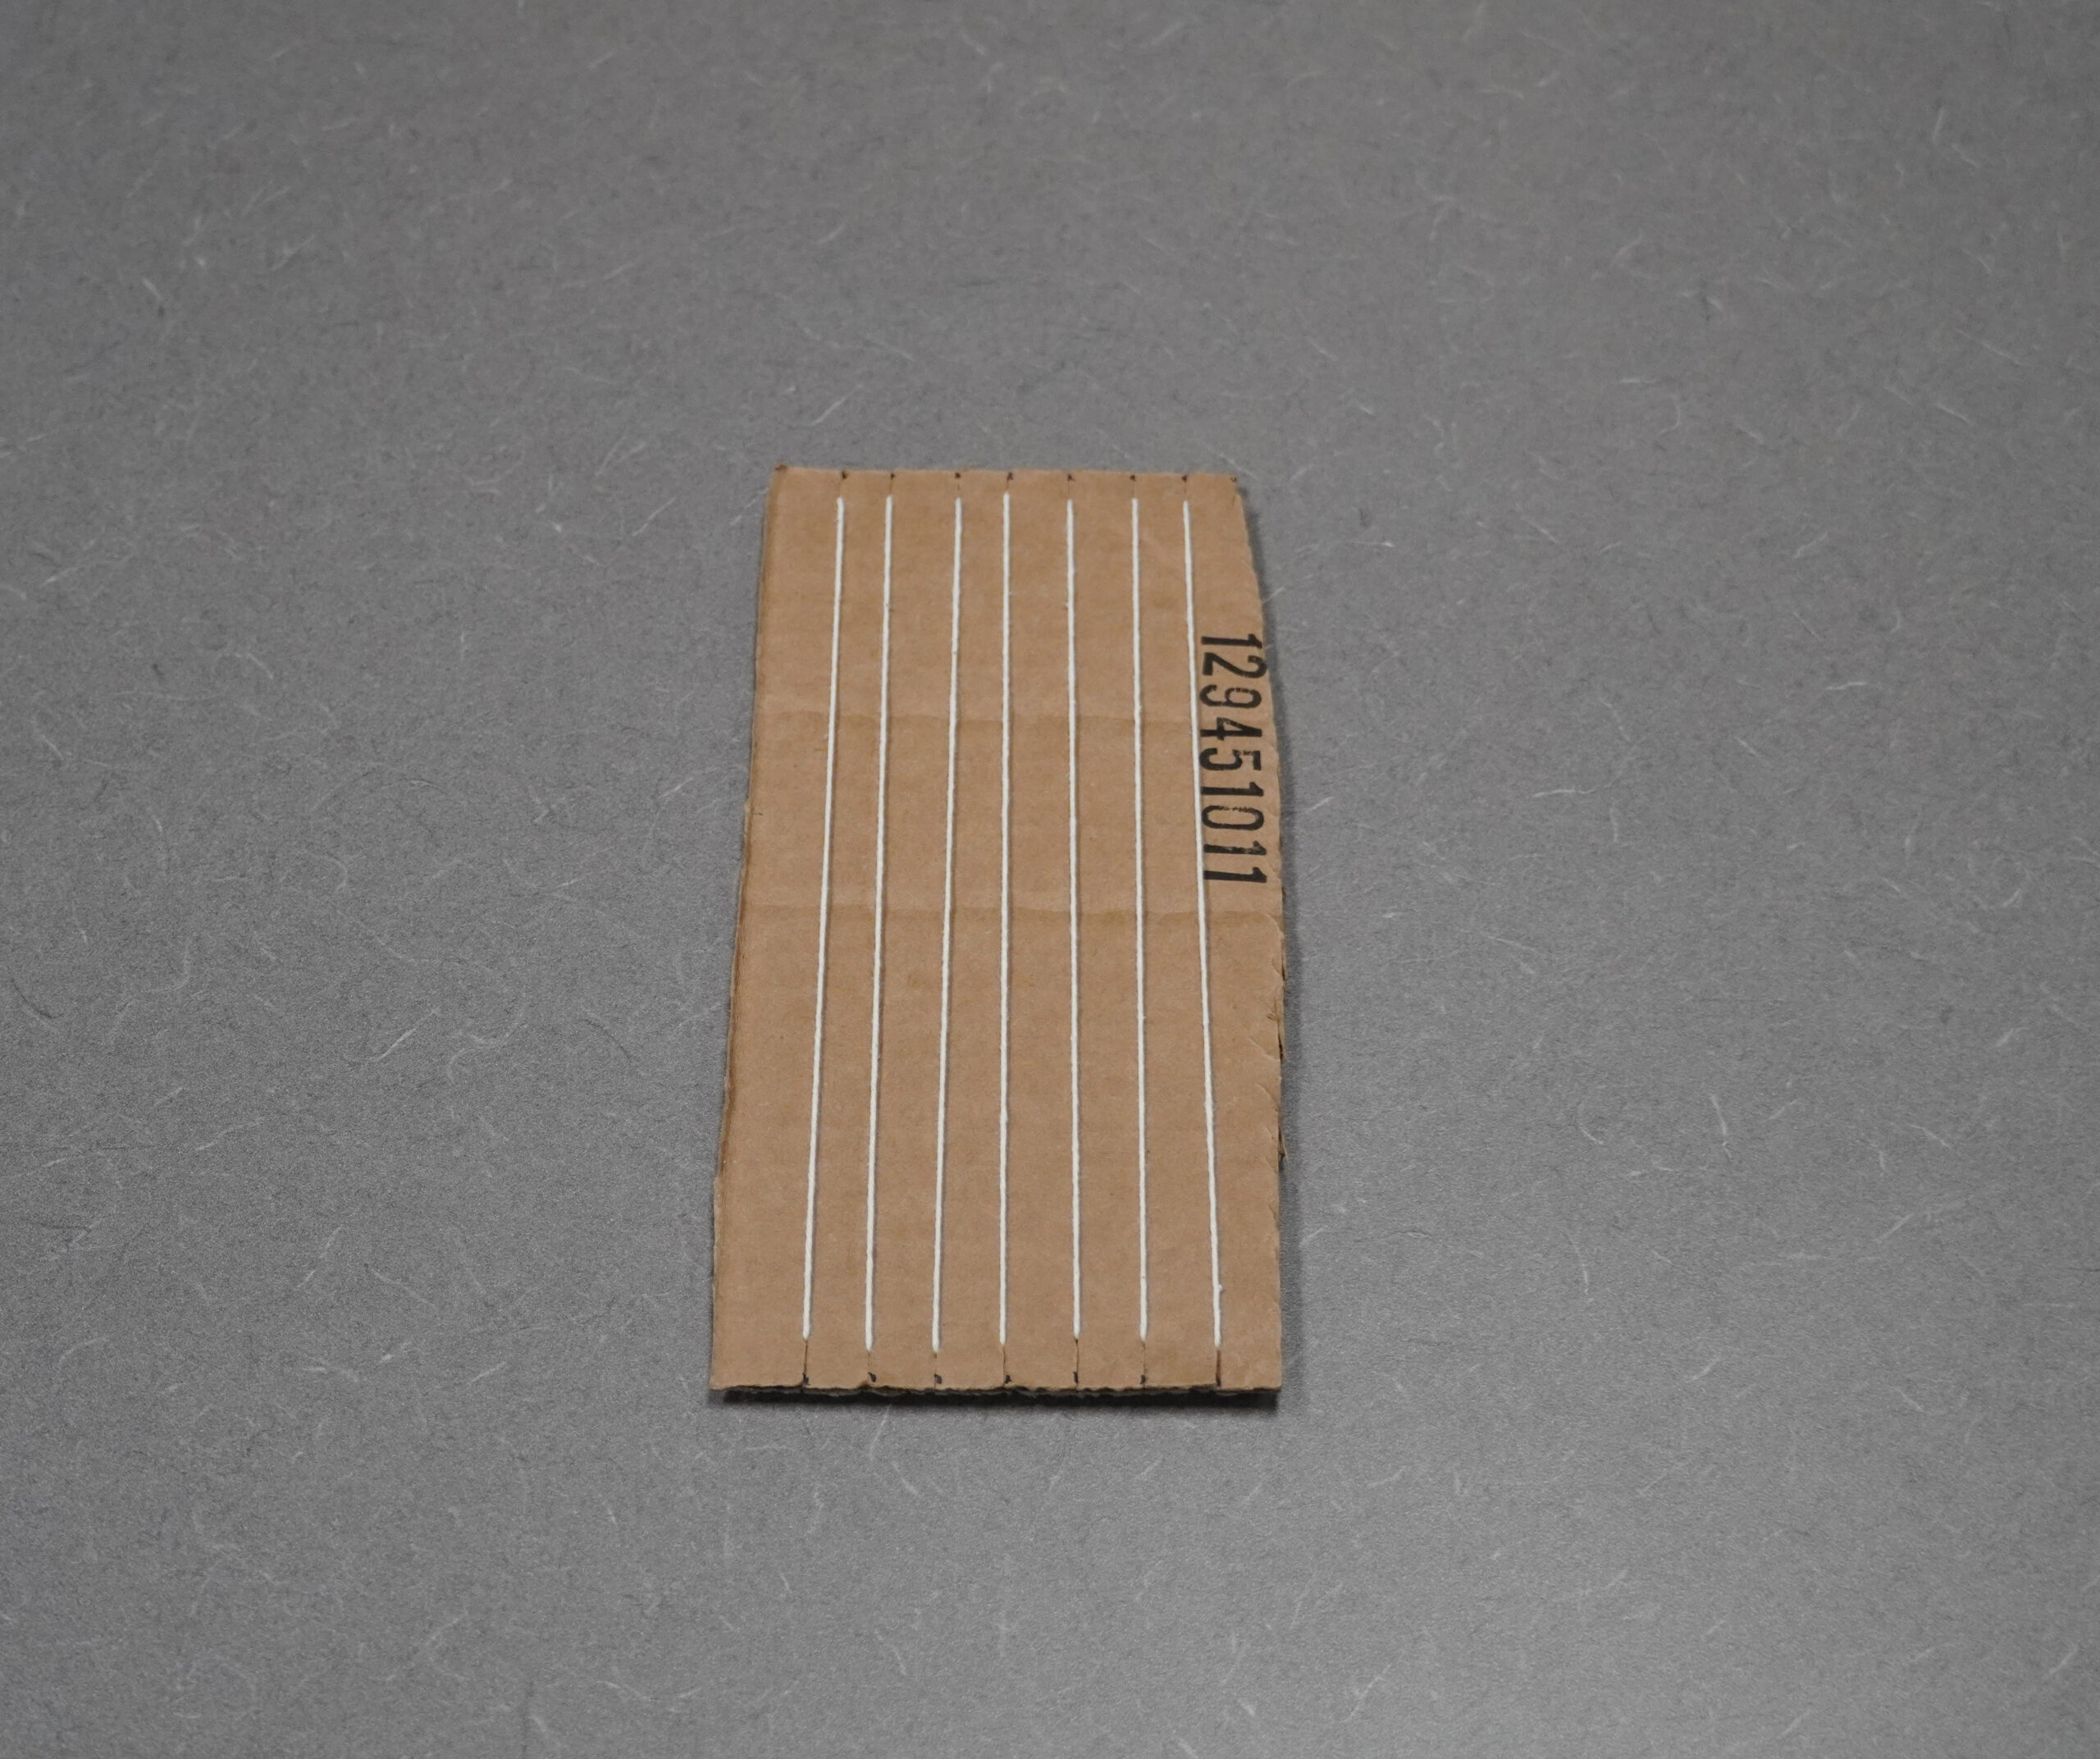
Completed view of the front.
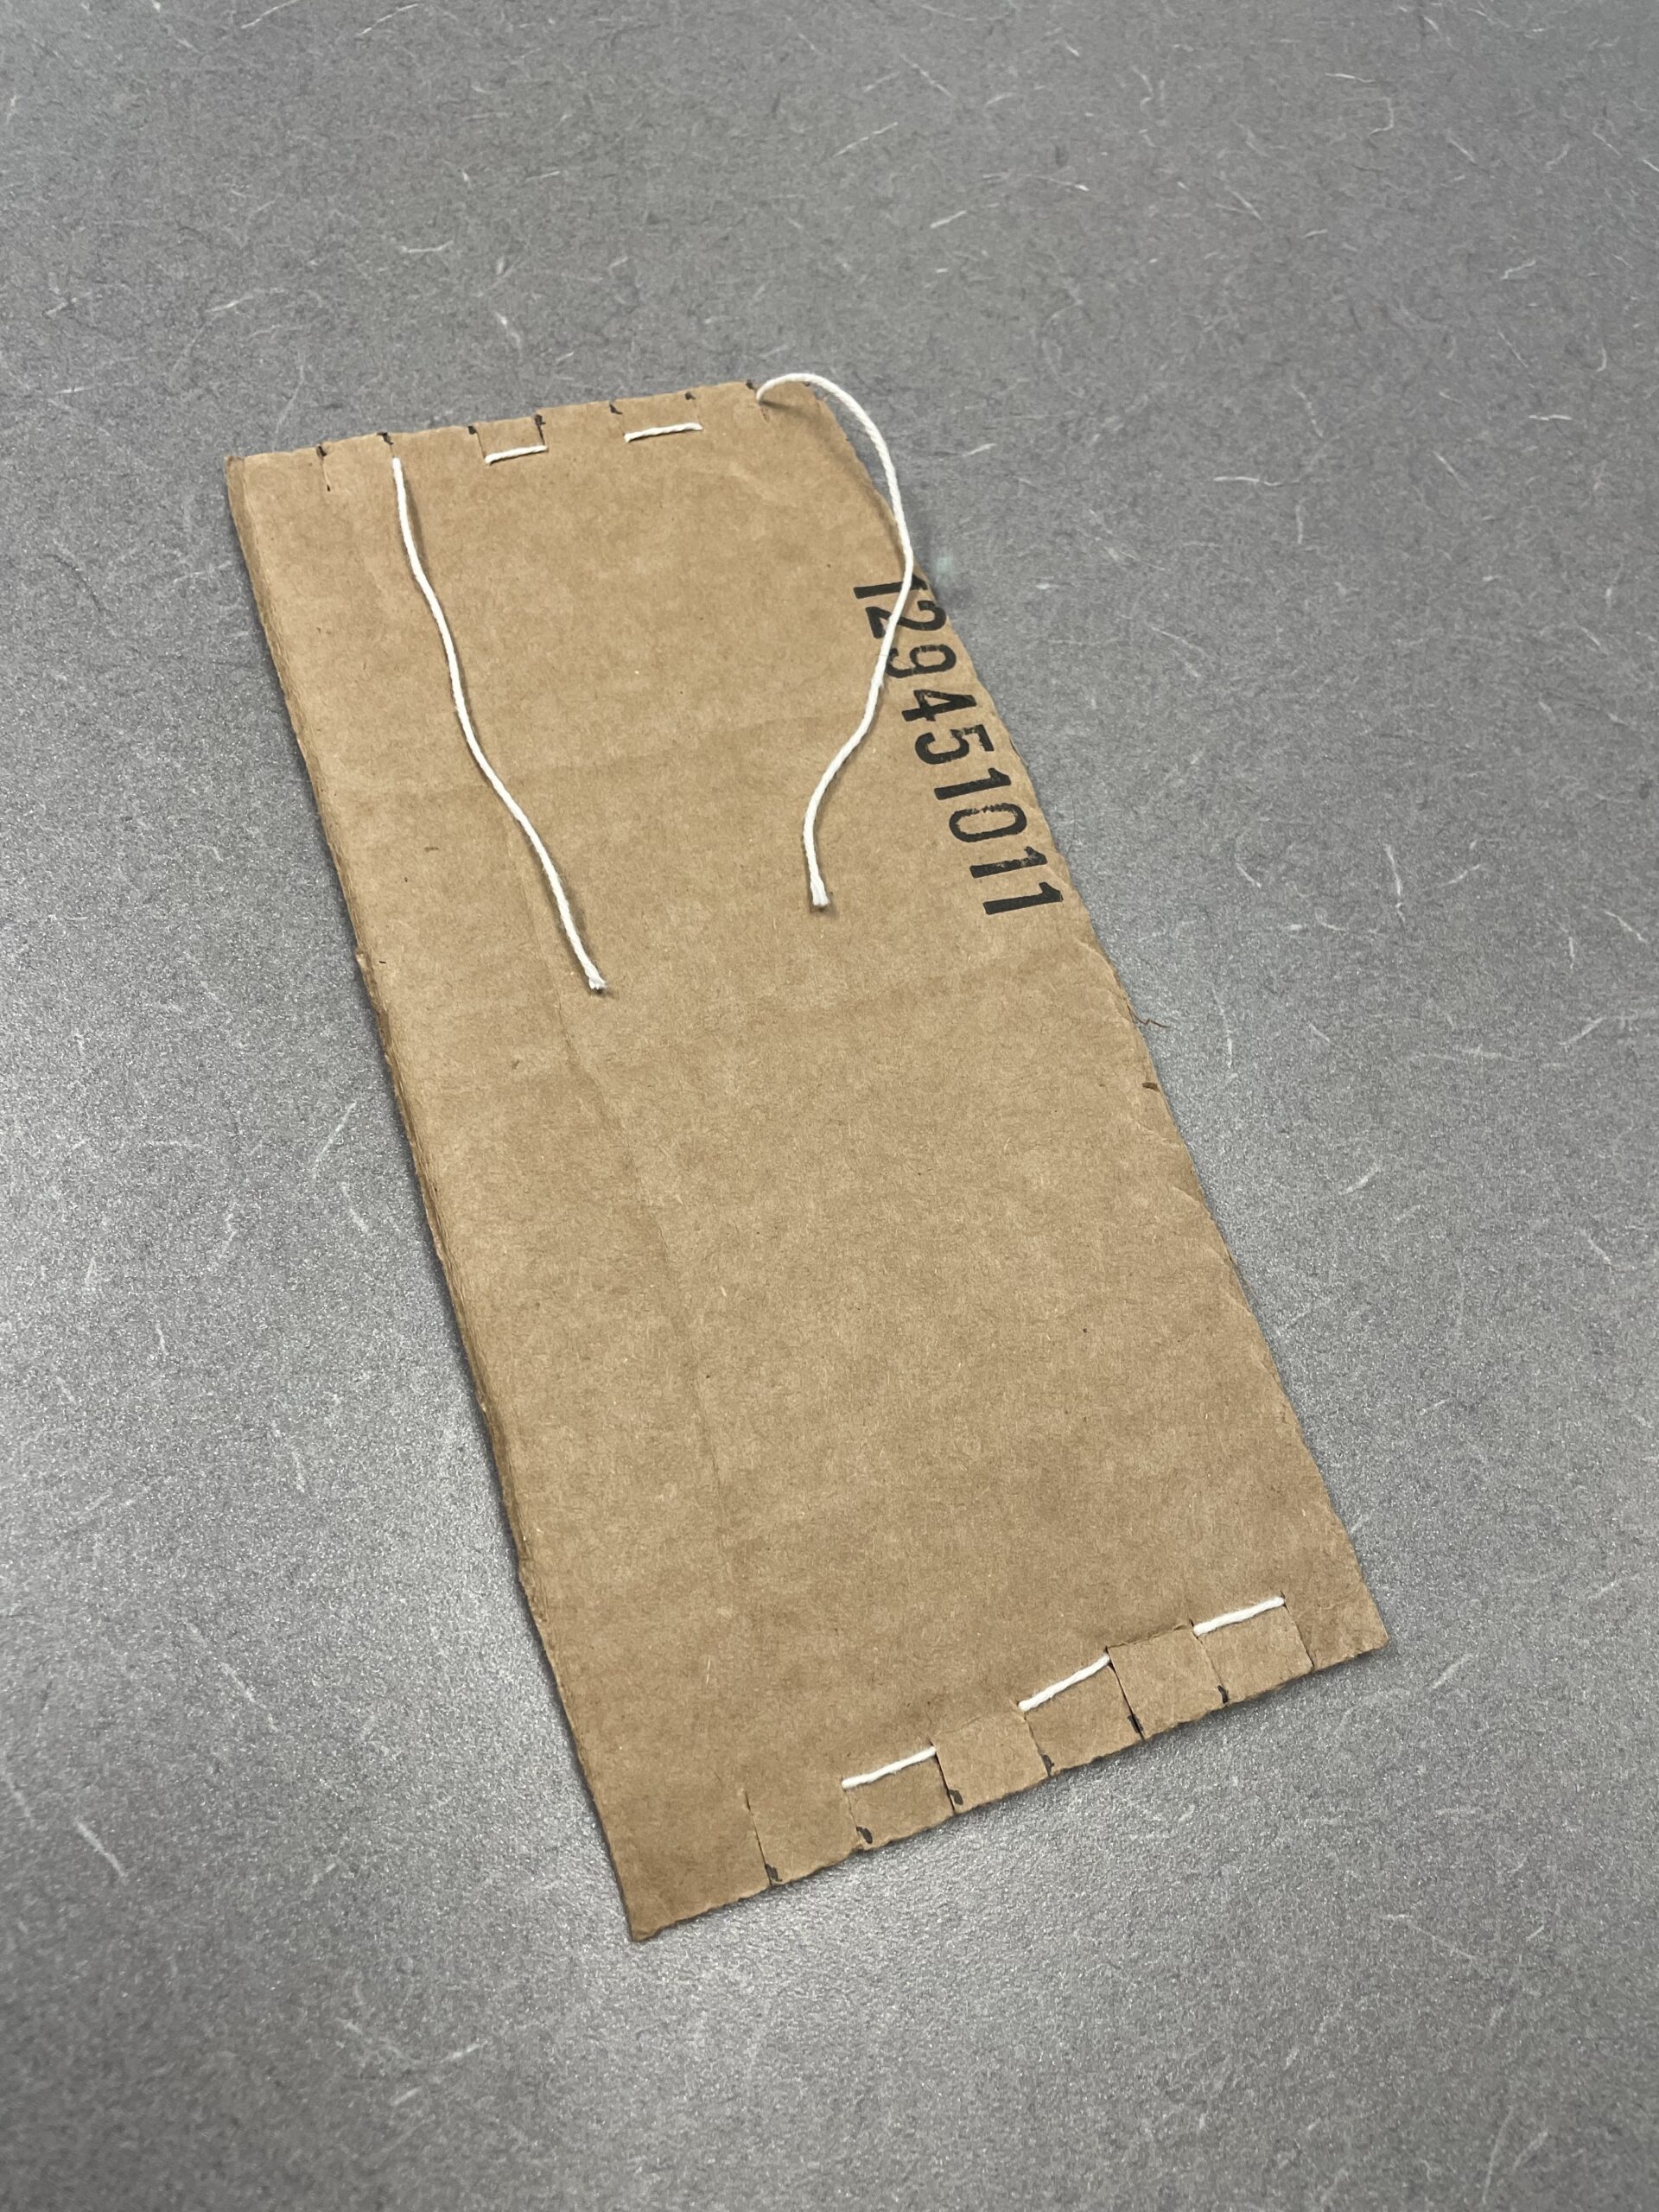
Completed view from the back. When you start working, you should flip it so that the tail ends are at the bottom.
Step 6: Weaving
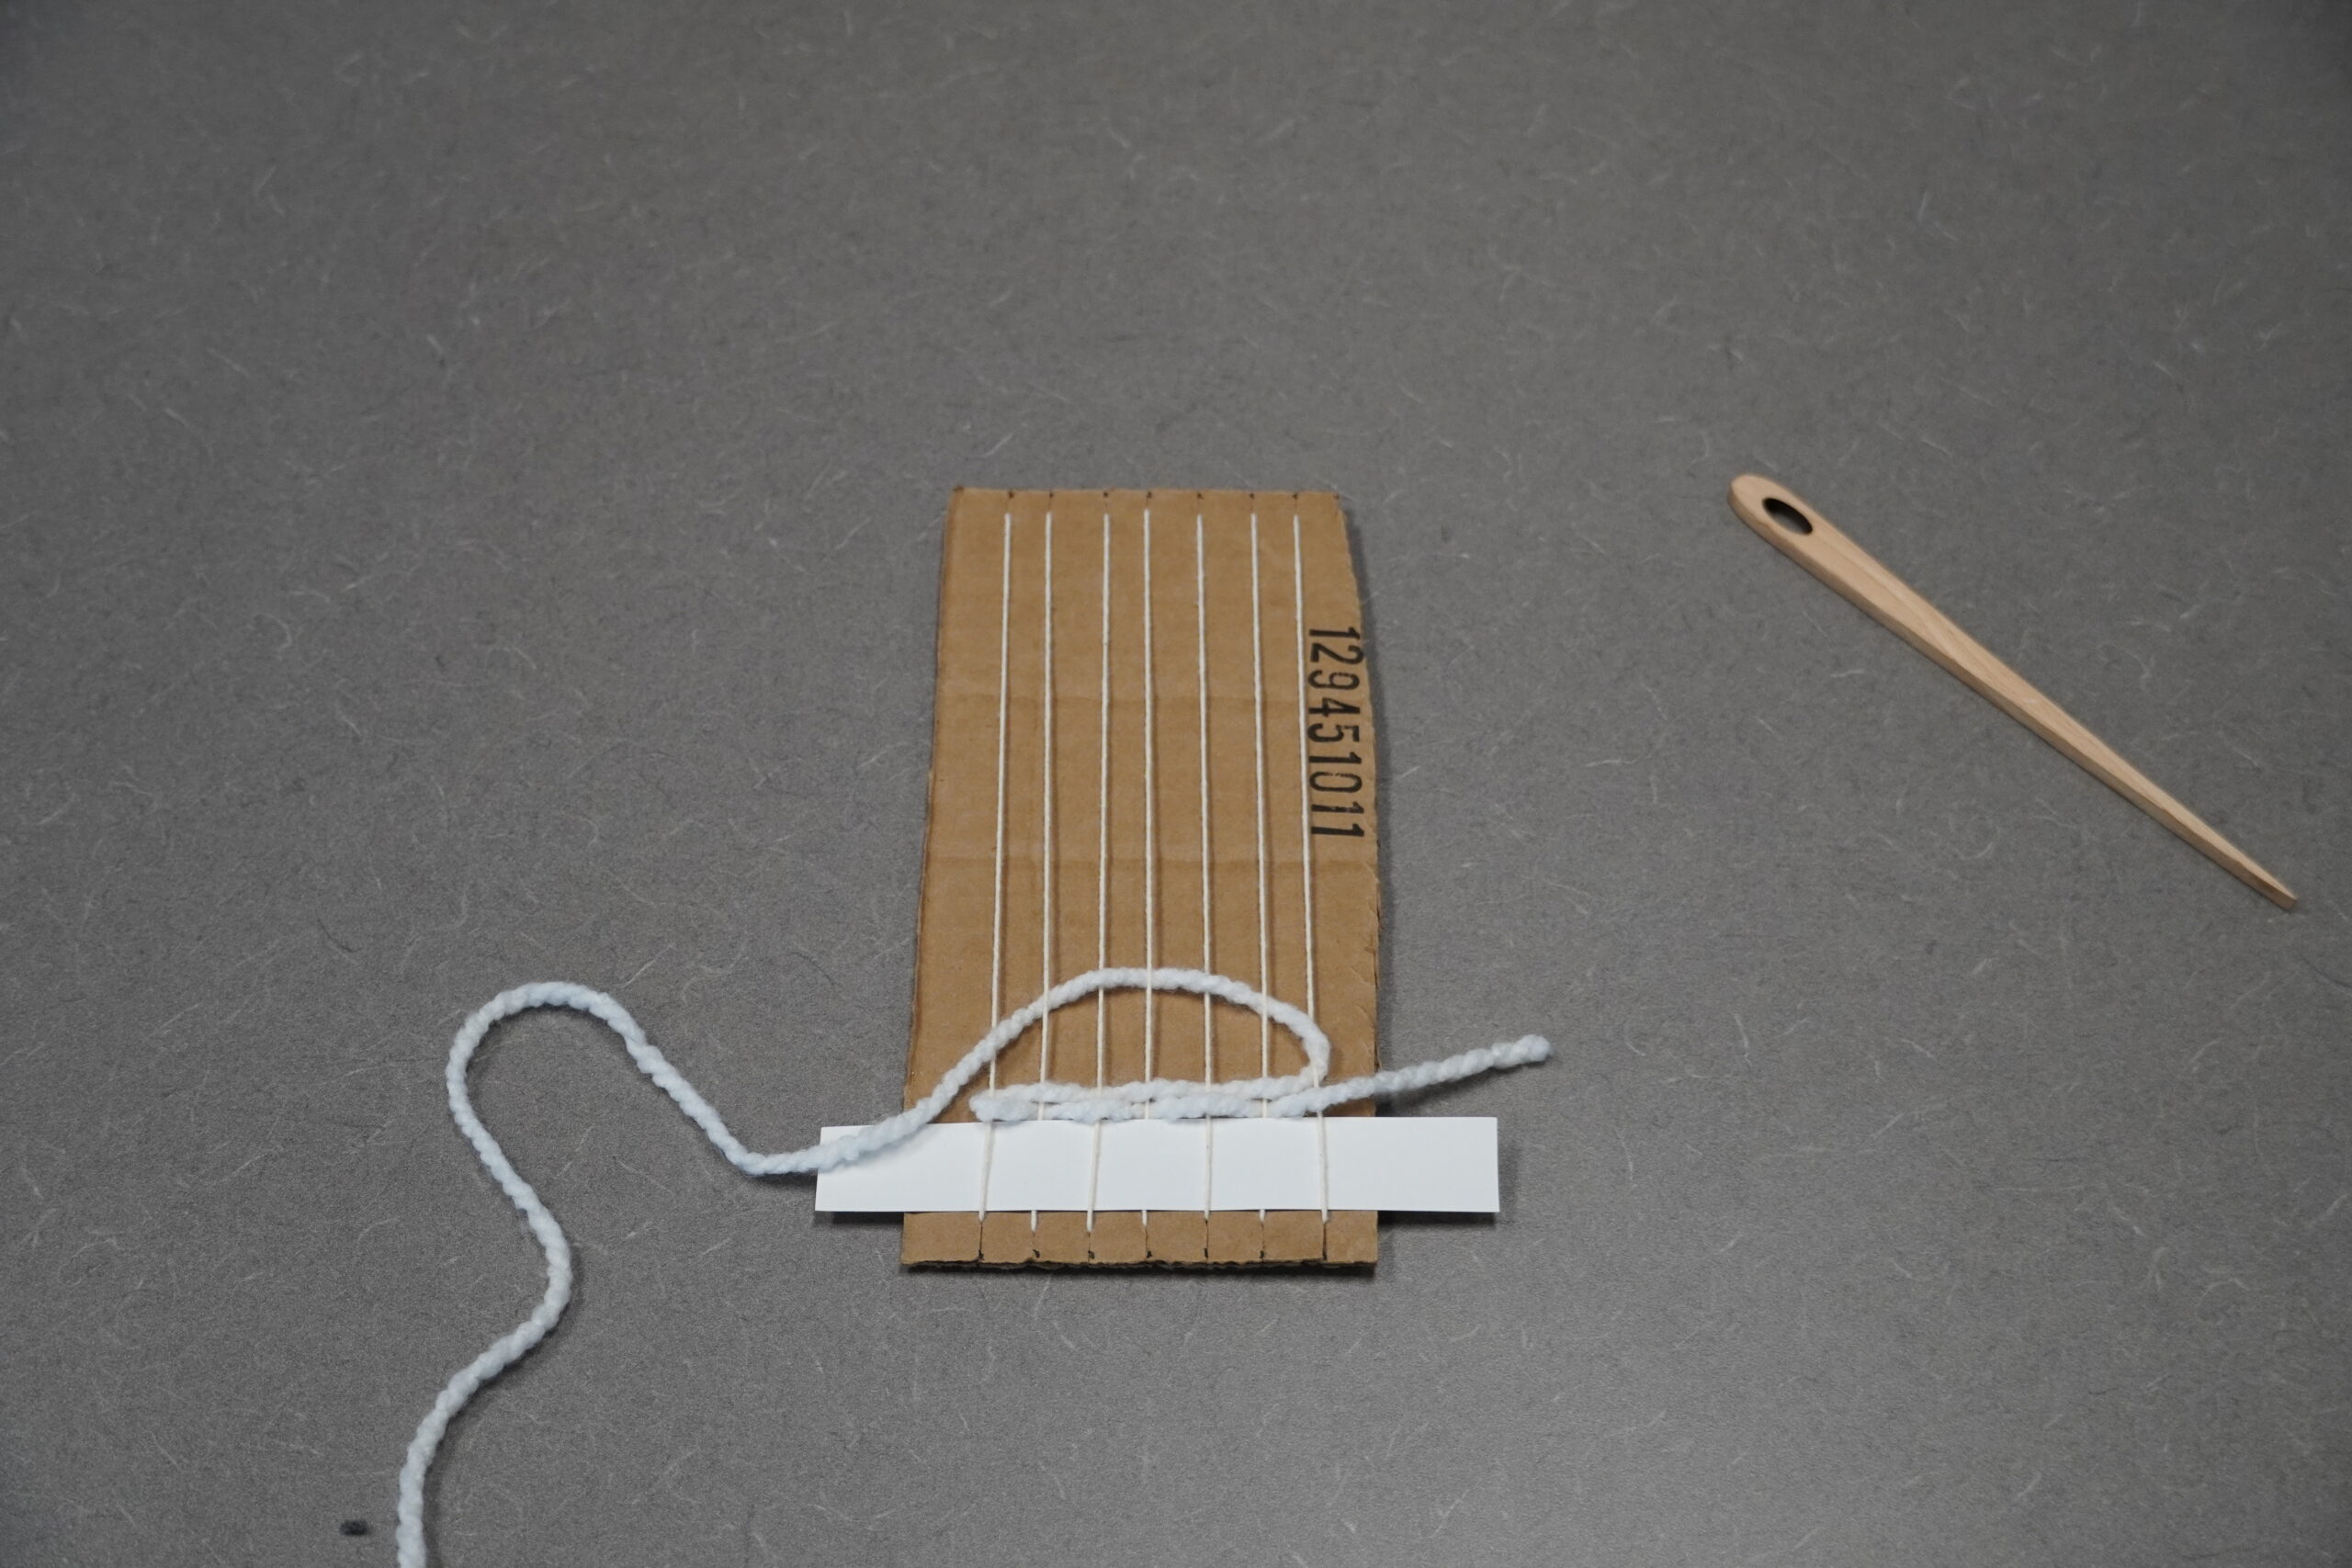
Create a base. Weave a strip of cardstock or flexible cardboard (such as a cereal box) at the bottom for stability, following a simple over-under weave—going over the warp string and under the next, repeating all the way across. This base provides a straight edge for weaving and also ensures there is enough string to tie off the tapestry when finished.
Optionally, add a twining stitch to maintain stability when the tapestry comes off the loom. A twining stitch creates a strong edge finish by twisting around the warp strings. It is best understood by watching a tutorial, such as the Spruce & Linen guide to starting a weaving.
Cardstock is used to create the base.
Weave from the bottom up using plain weave—simple over and under, back and forth across the warp. Pulling tightly across will start to build tension and bring the sides closer and closer together. Avoid this by making an arch shape as you pull the yarn across the warp and then push it down.
The weft is pulled up and then across in the shape of an arch, helping prevent building too much tension.
Tapestry weaving typically starts from the bottom and moves to the top. I wanted my tapestry to somewhat represent the webpage visually, so I started at the bottom of my data table and worked in reverse order, rendering the diffs in thread: unchanged text, deletions, insertions, modifications.
Experiment with stitches. You may stick to plain weave for simplicity or introduce new weaves for modifications, looser weaves for deletions, or loops for errors. However, a selection of yarn weights and textures can add a lot of variety to a tapestry without teaching new knots. When working with roving or cord, try pulling a little out of the warp threads to build some texture. Roving is unspun wool and its fluffy texture provides a nice contrast.
When you begin and end a new piece of yarn, leave a few inches hanging off the side to be tucked in later.
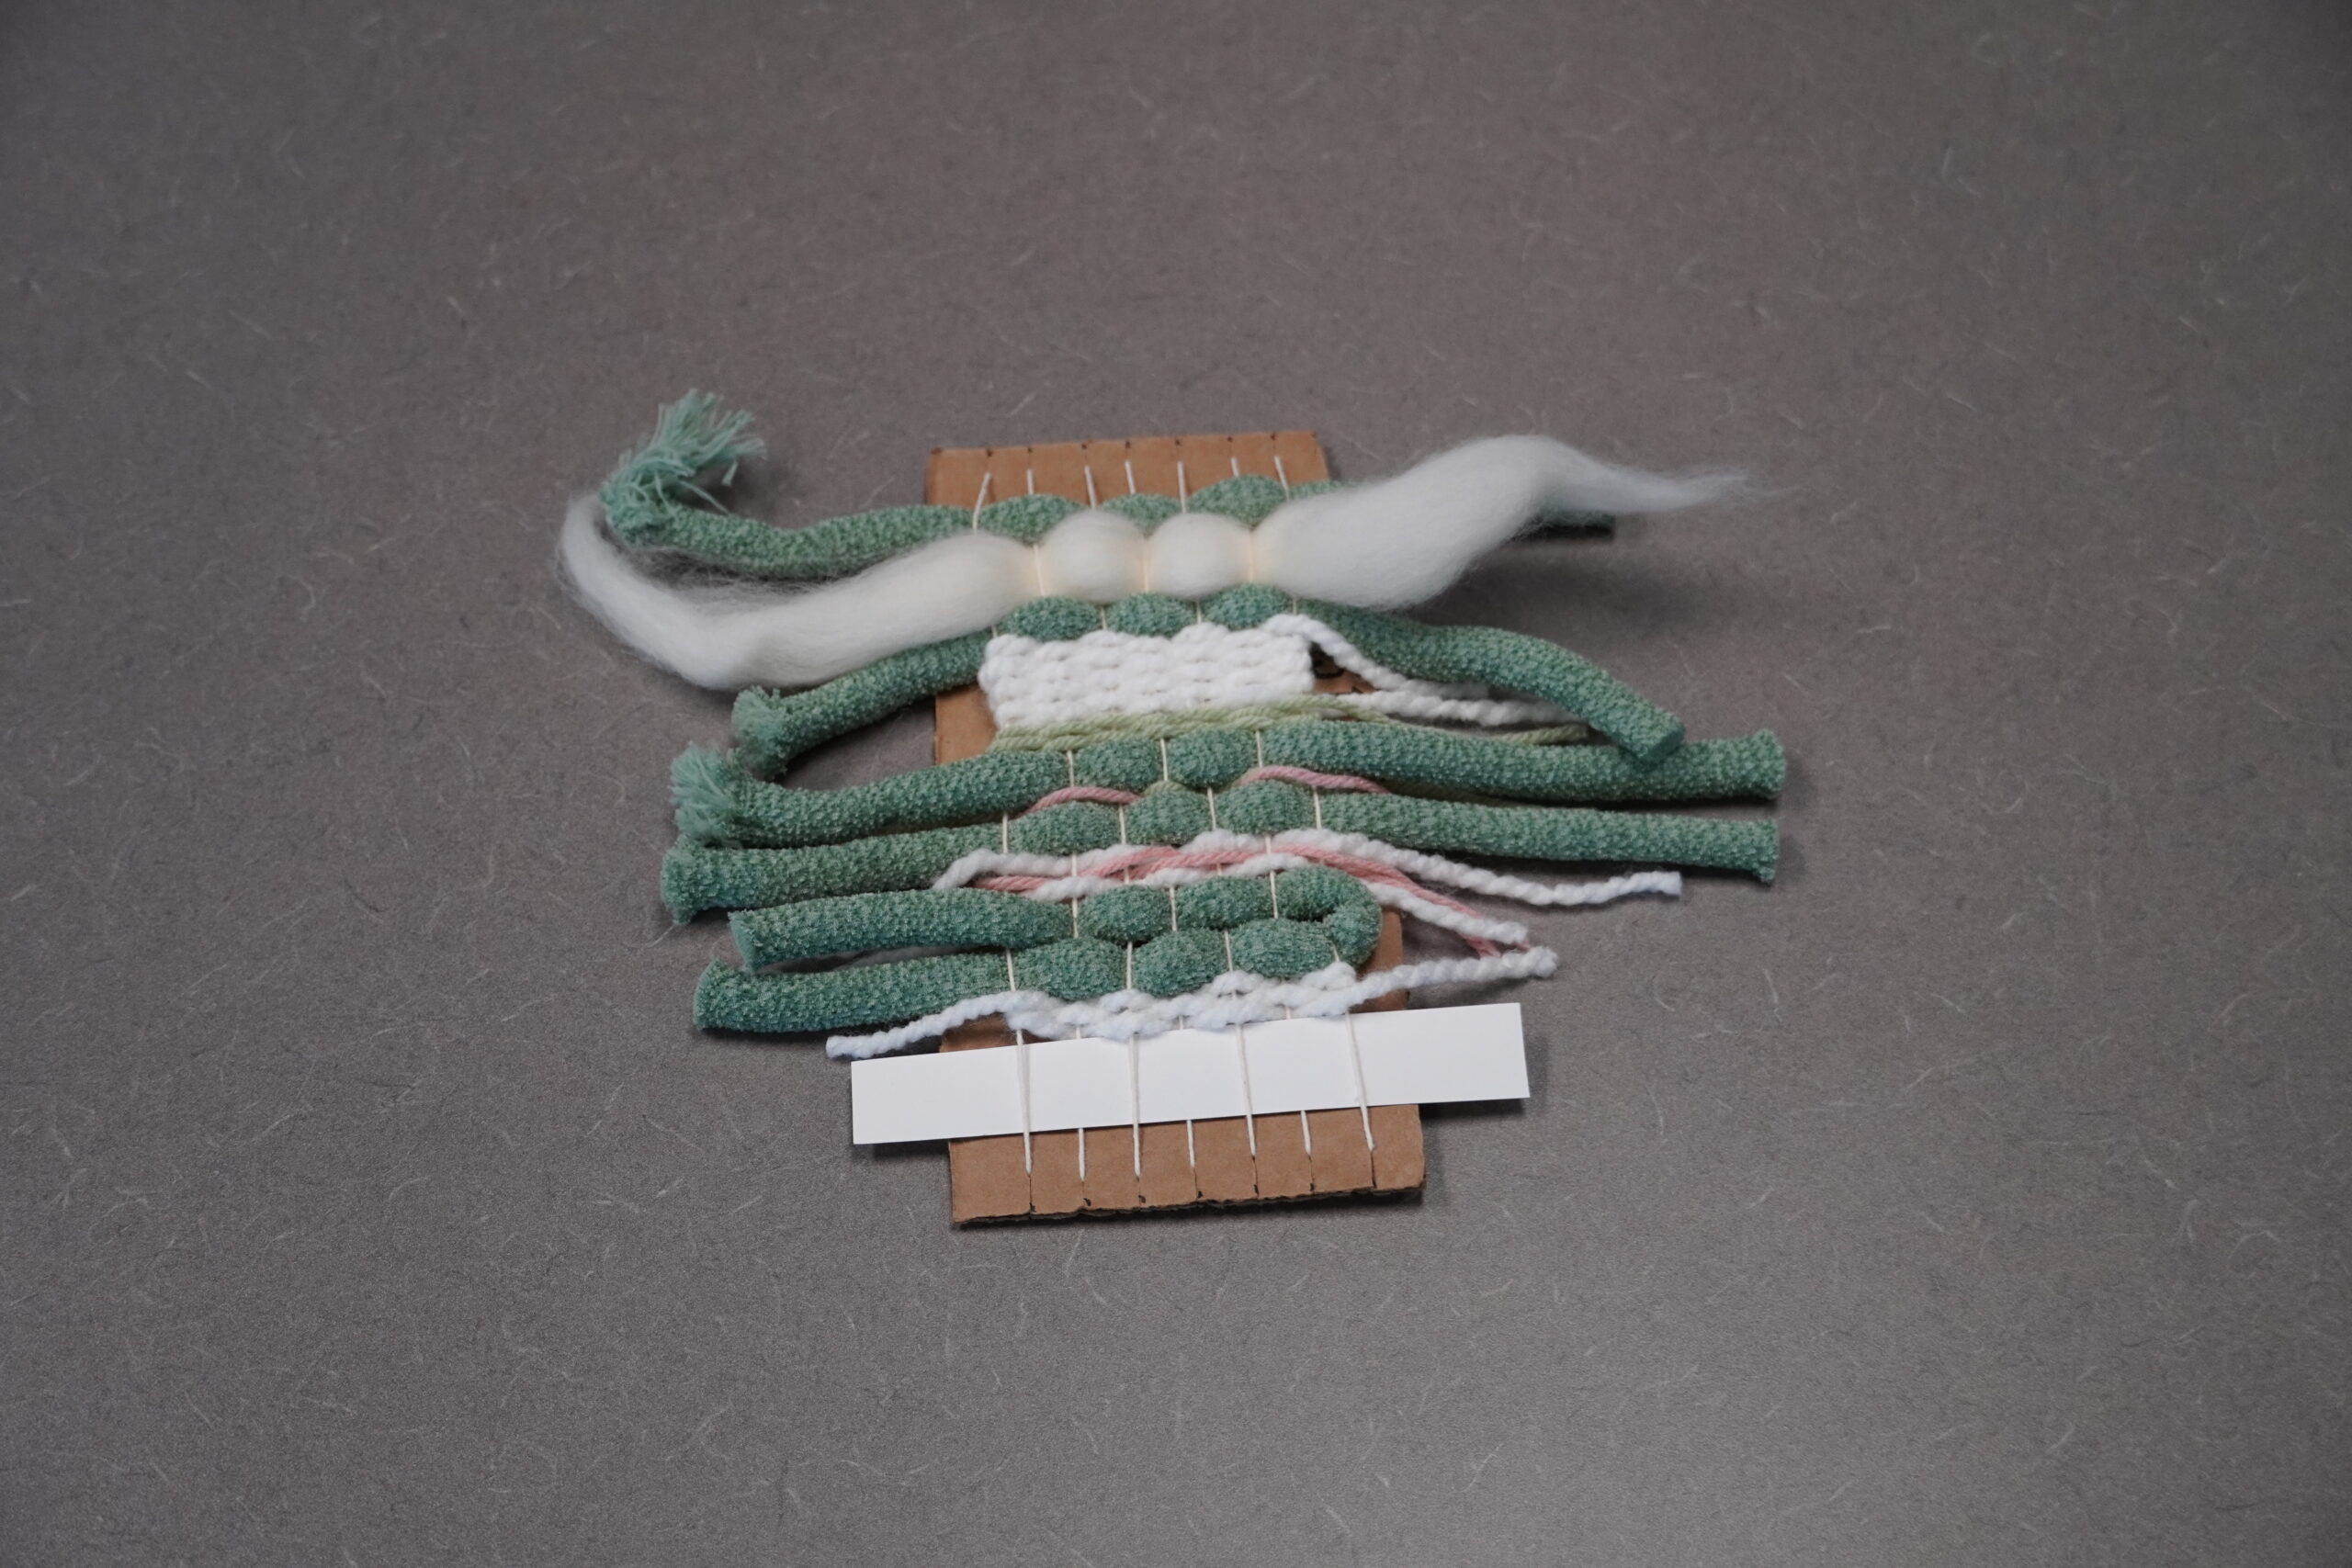
The long ragged ends will be woven into the back.
The majority of this piece is completed using plain weave. The introduction of different materials provides visual interest without increasing technical difficulty for beginners.
Step 7: Removing the weaving
Before reaching the top, optionally secure the tapestry with a twining stitch, the same as at the bottom if you did that. Cut the warp threads at the bottom, leaving enough length to tie off in pairs. These can be left hanging or woven into the piece.
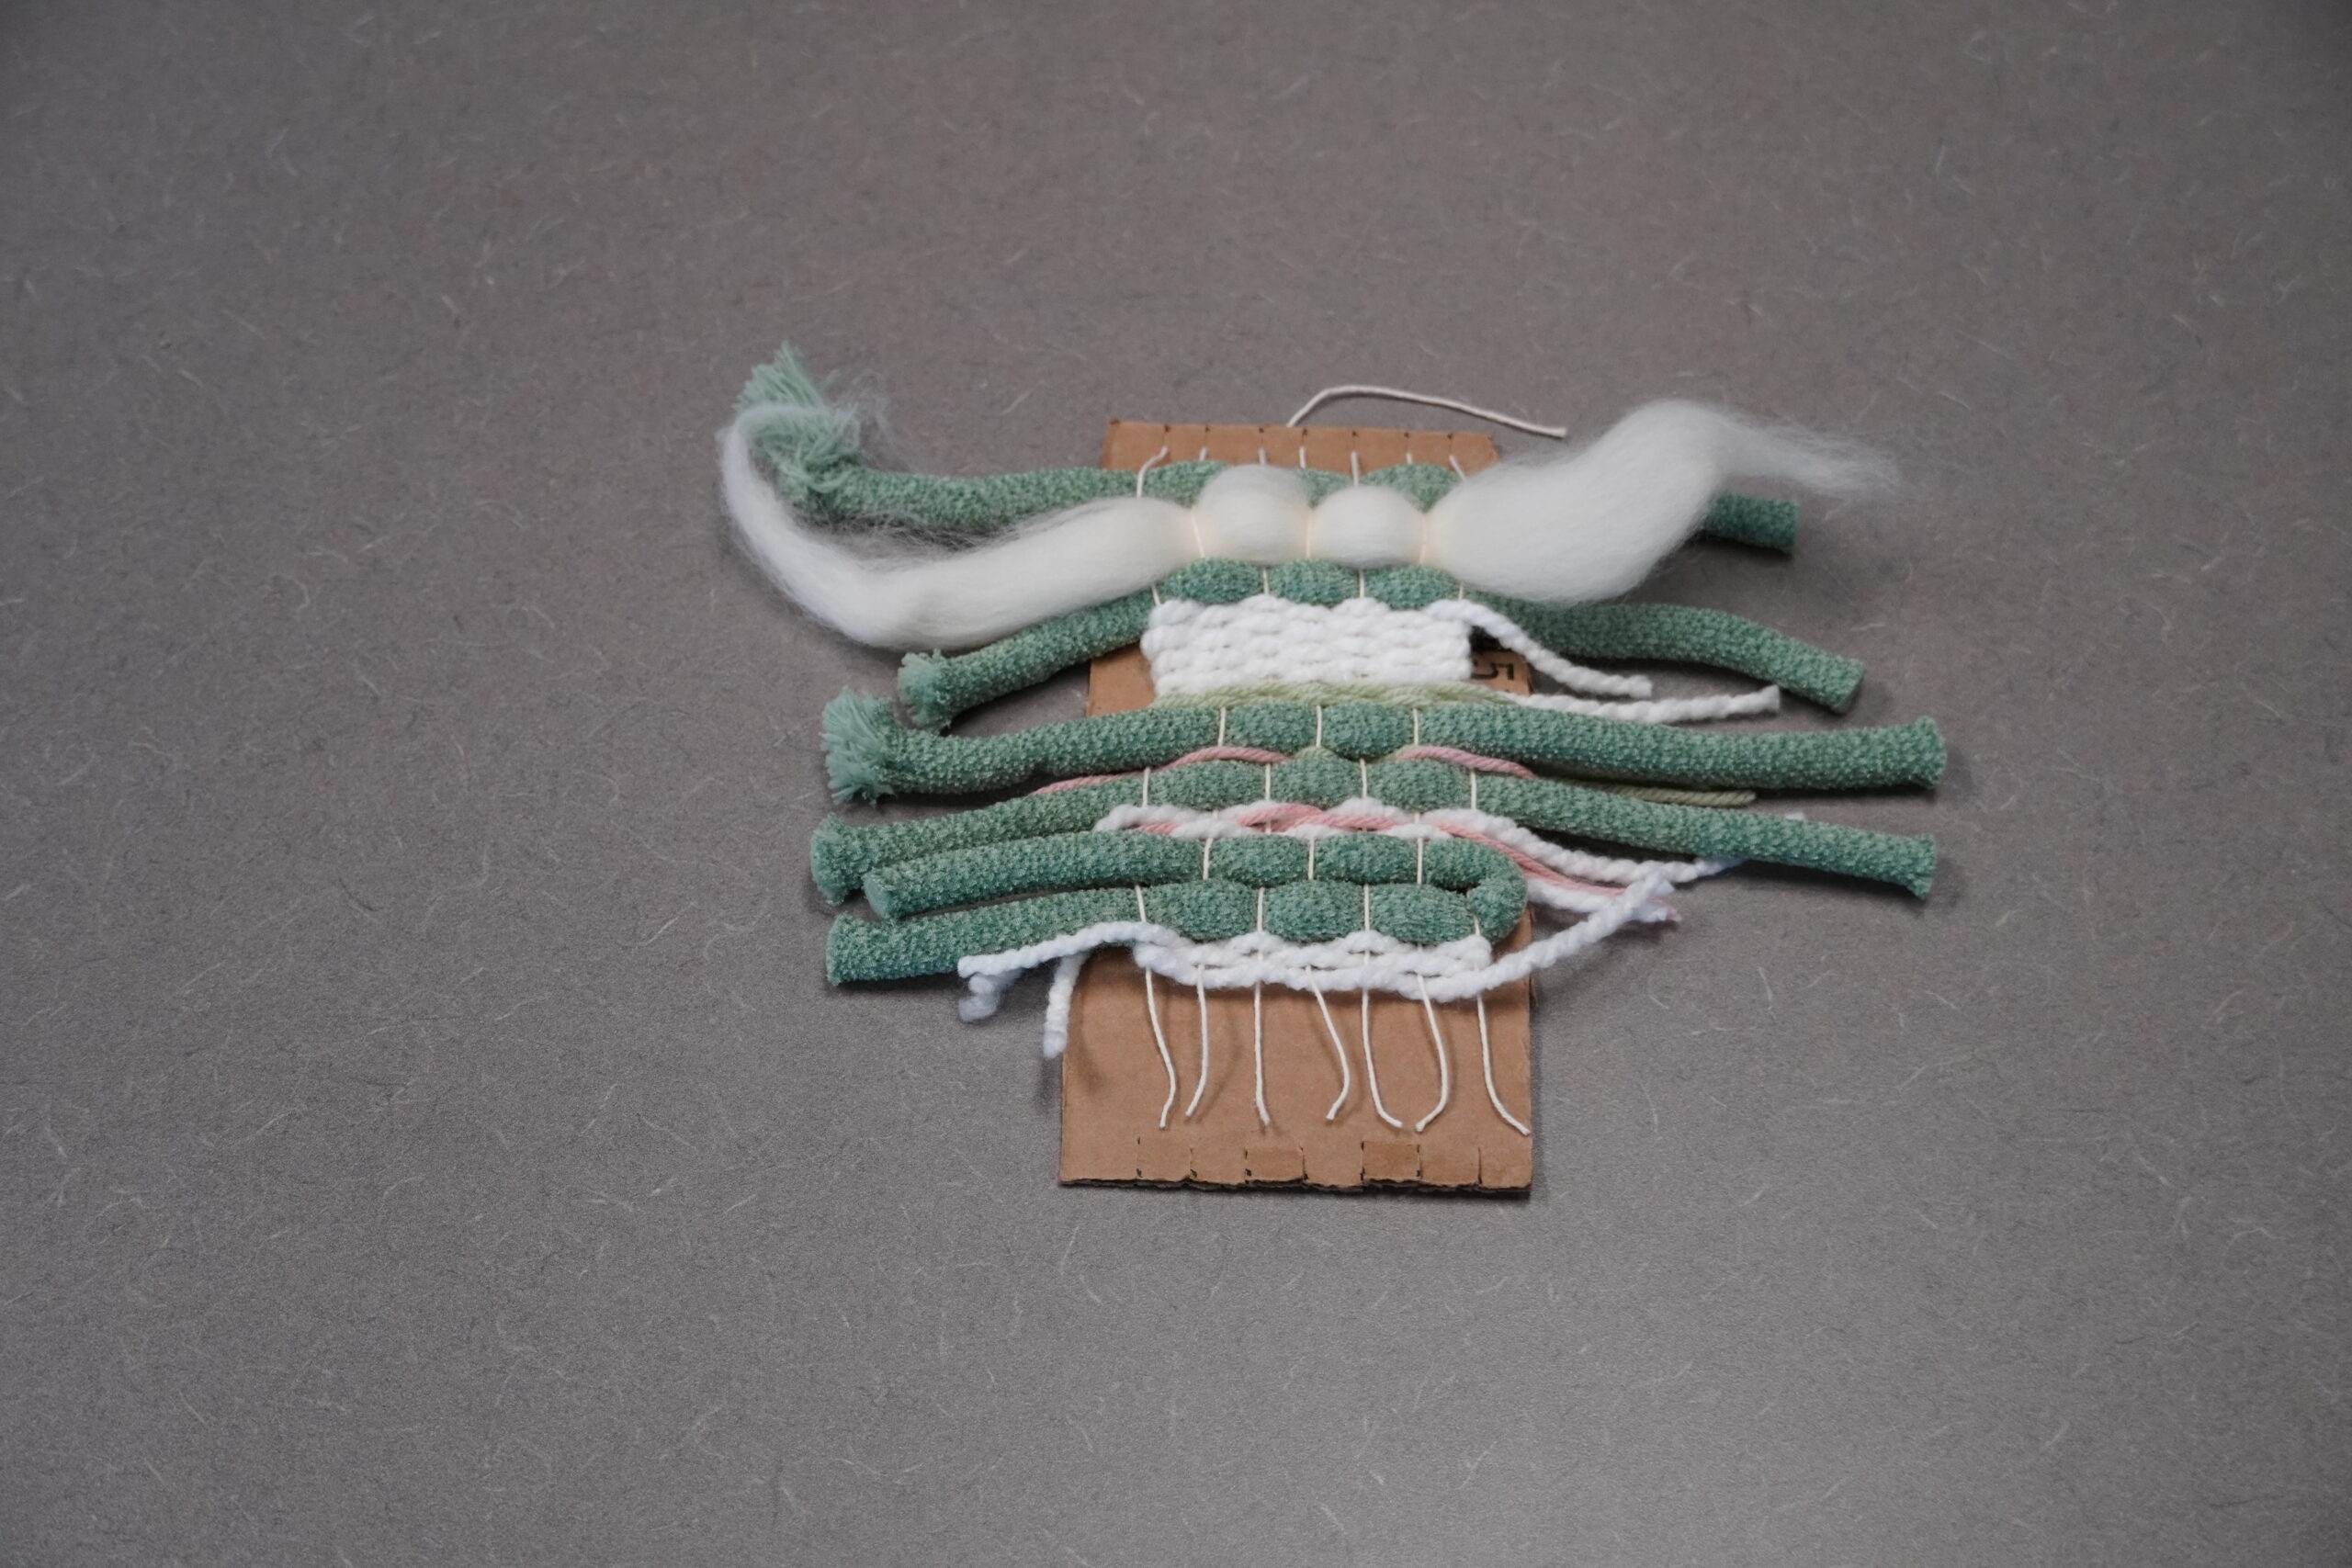
The tapestry is still on the cardboard loom, but the bottom threads have been cut at the longest possible length.
After tying off the bottom strings in pairs, release the warp loops from the top and leave them as they are.
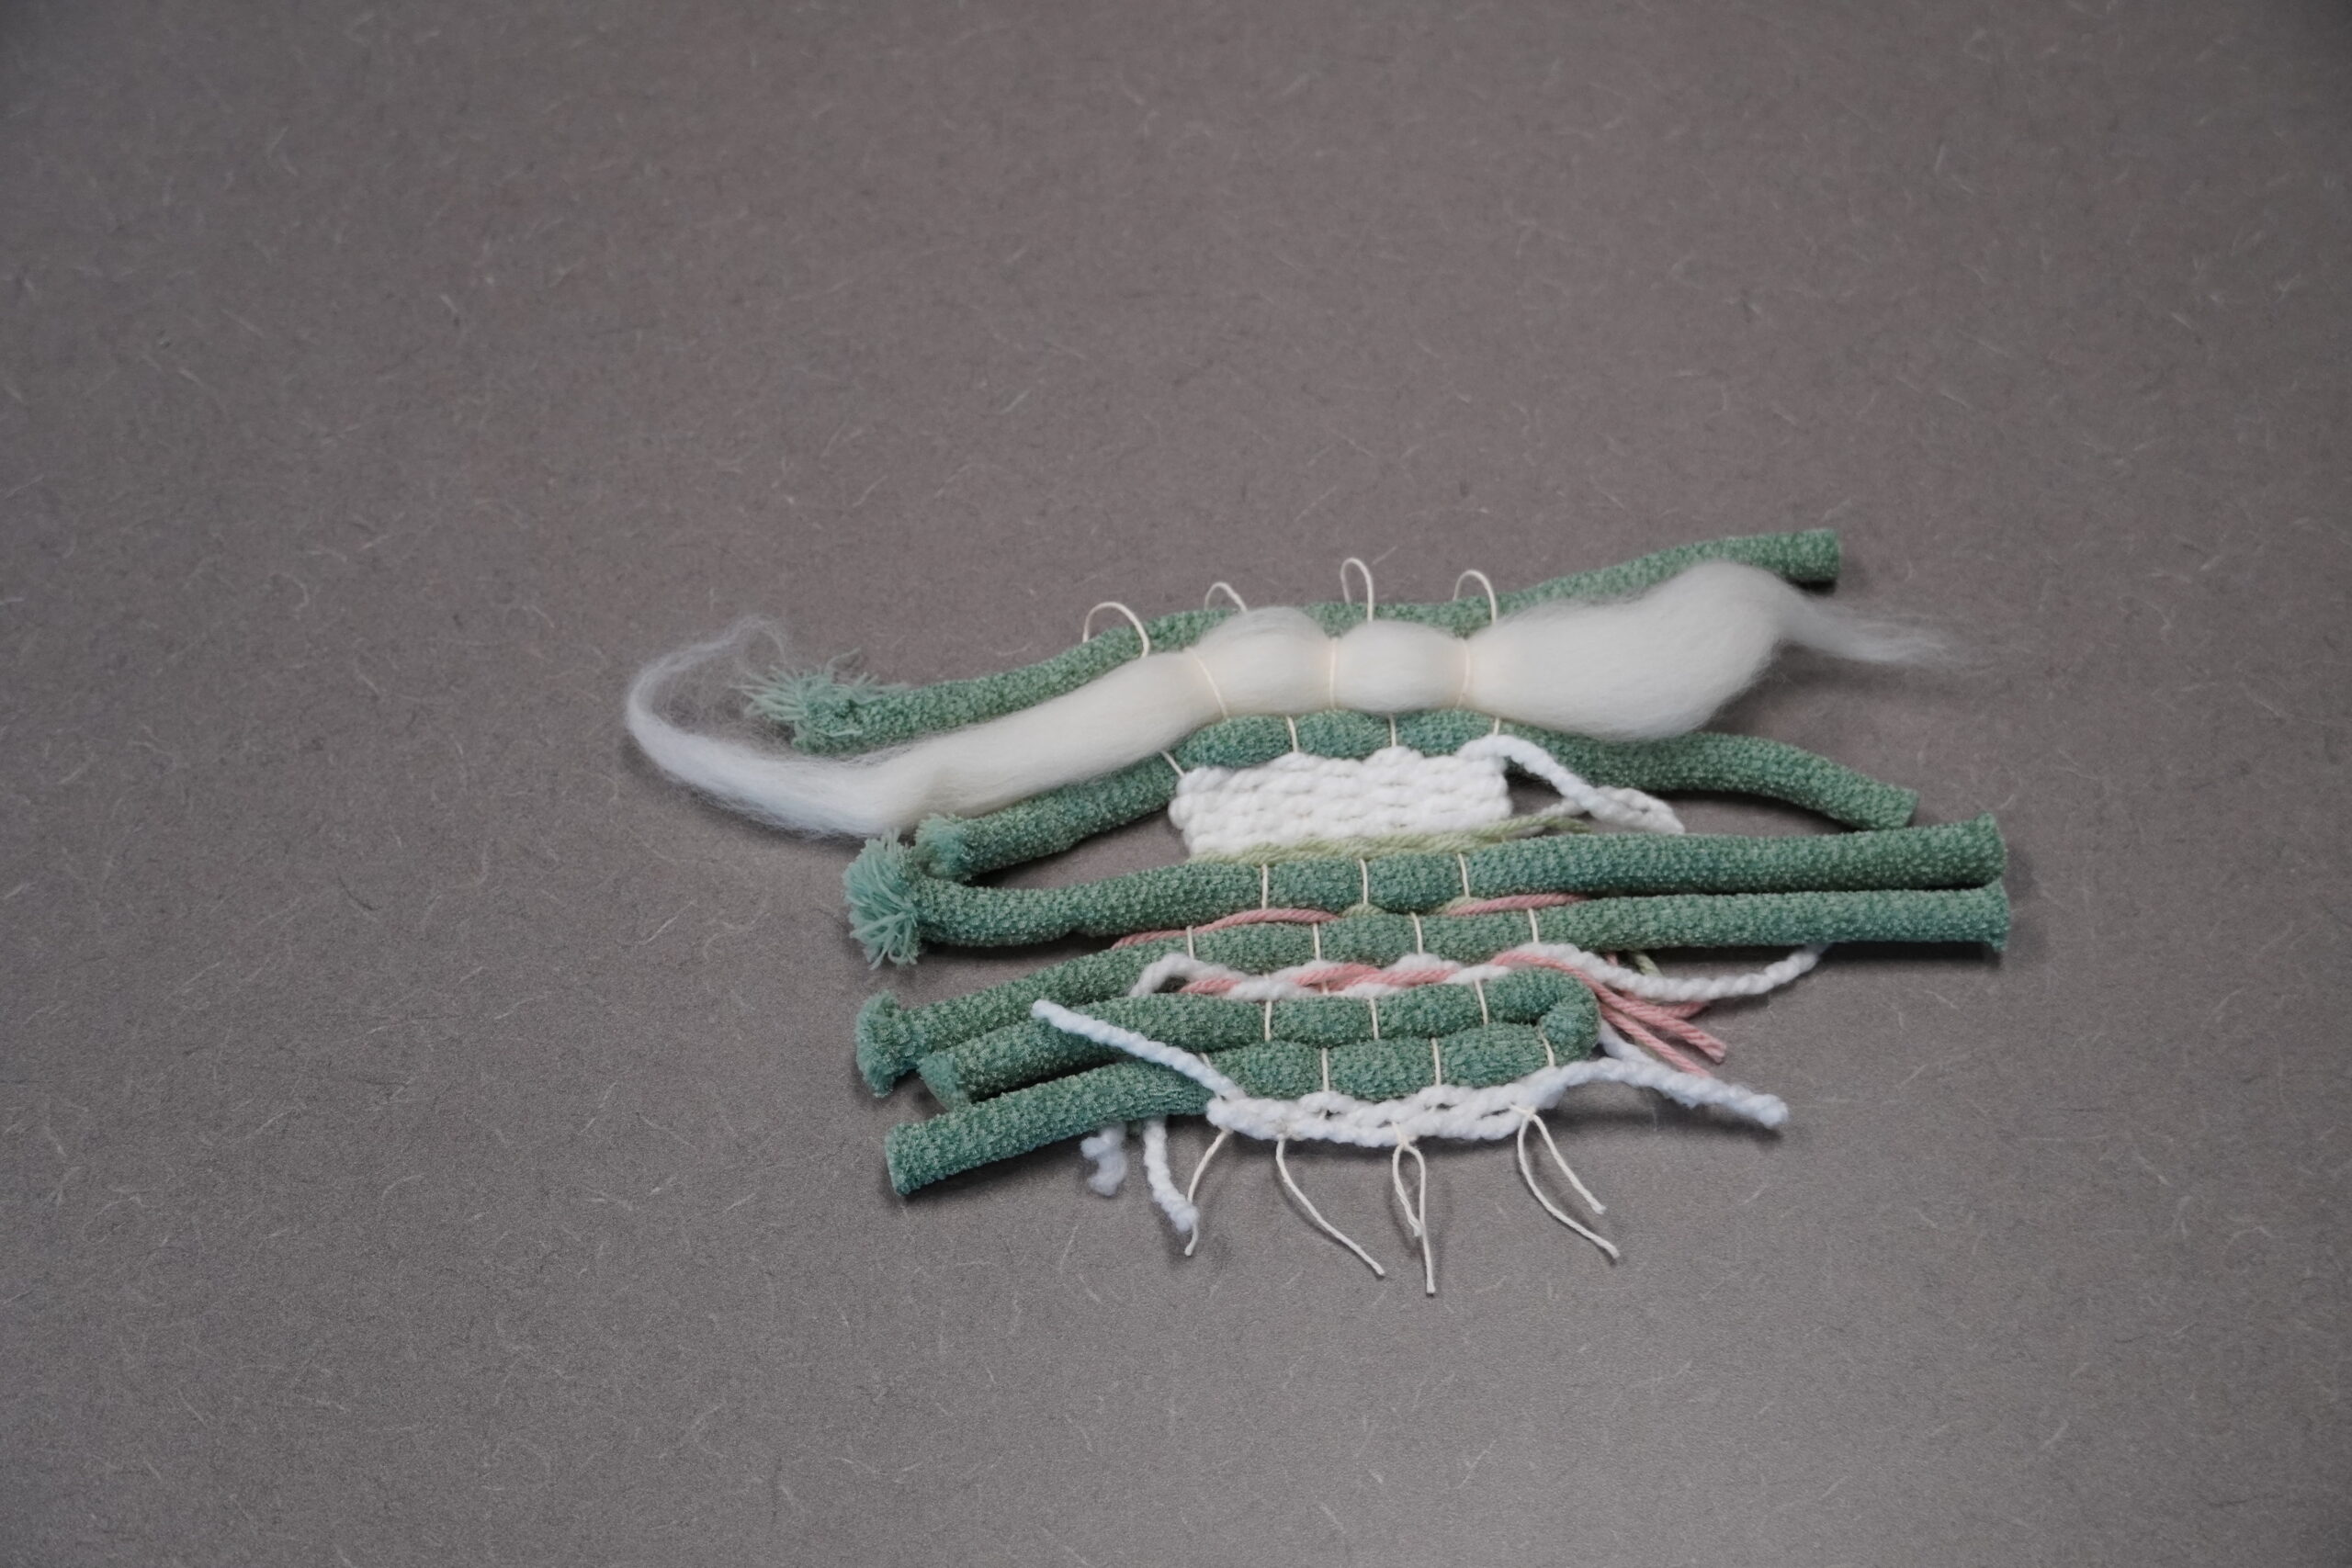
The tapestry is off the loom. The bottom ends have been tied off in pairs and top loops are available to slide over a dowel or popsicle stick for hanging.
For a detailed walkthrough of creating a mini tapestry, I recommend the Spruce & Linen 3-part tutorial by Jenell Flynn, which was how I learned.
Step 8: Finishing touches
Flip the tapestry over and weave in loose ends using a darning needle. The back side of the tapestry may not be clean, especially if you are using a variety of textures.
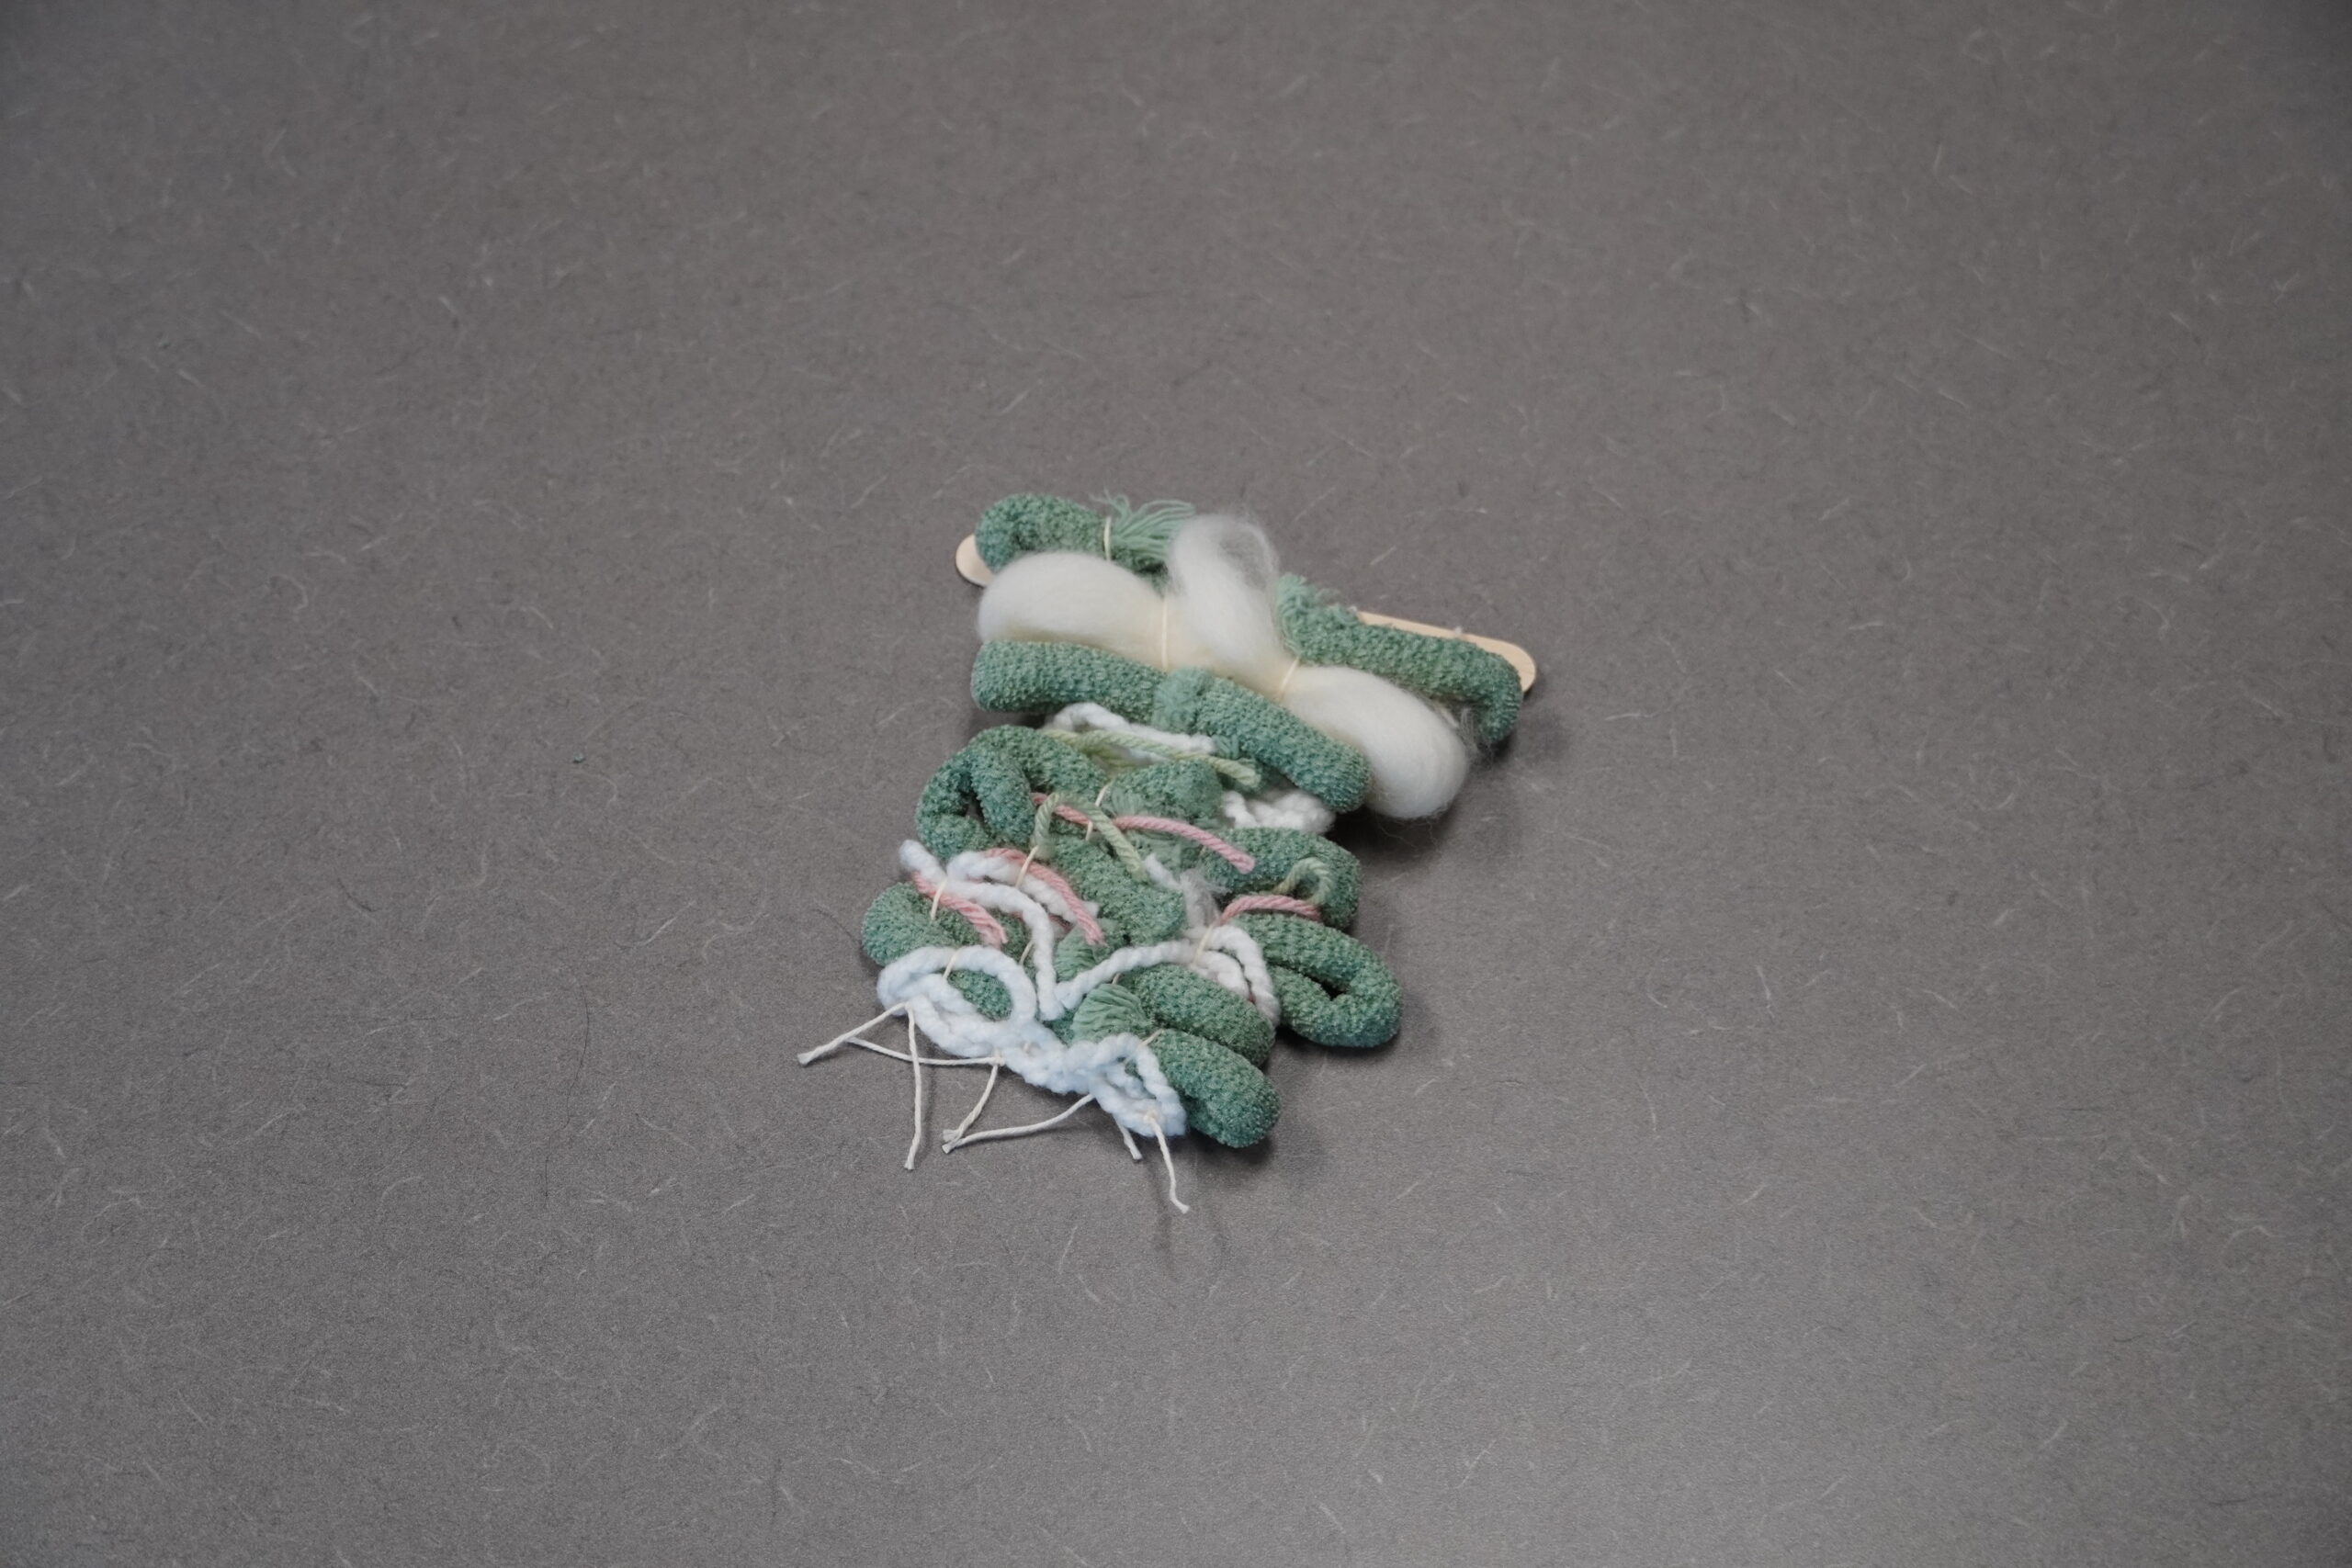
The ends are tucked into the back of the piece. Make sure to leave the ends long enough to do this. The wide contrast in yarn weight, narrowness of the piece, and frequent shifts between colors have made this piece a bit uneven.
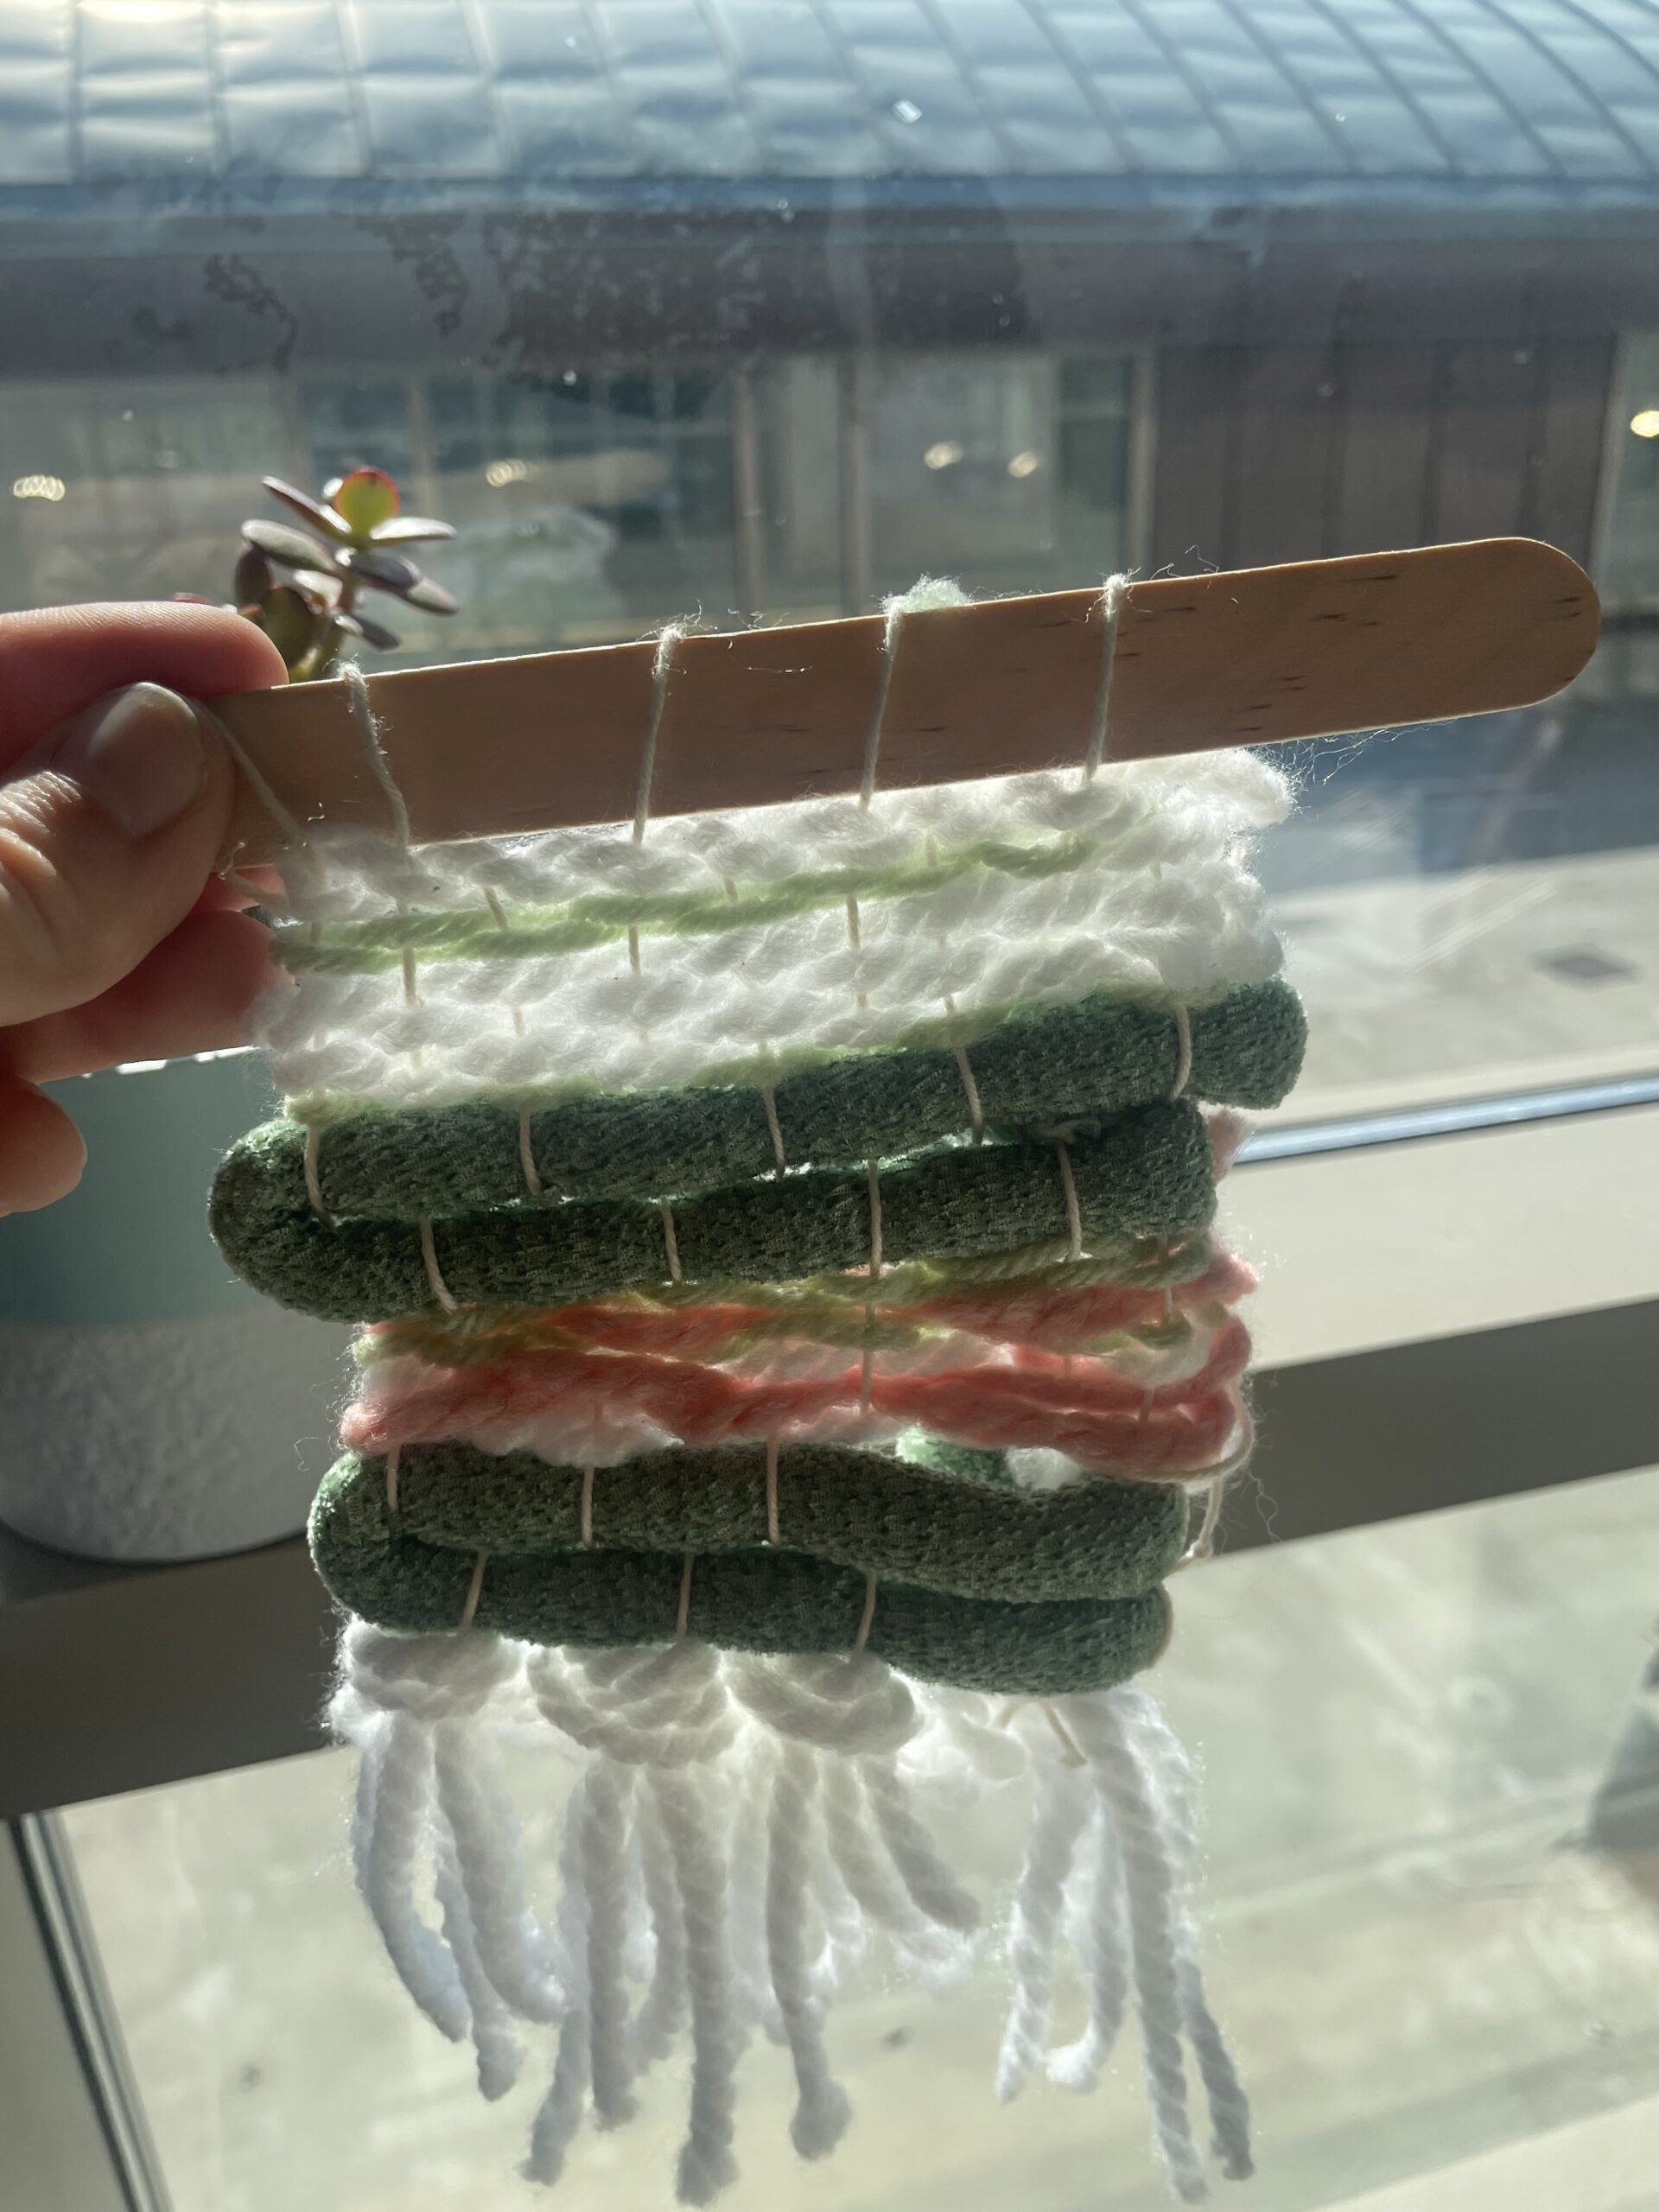
Thread a dowel, stick, or popsicle stick through the warp loops for hanging.
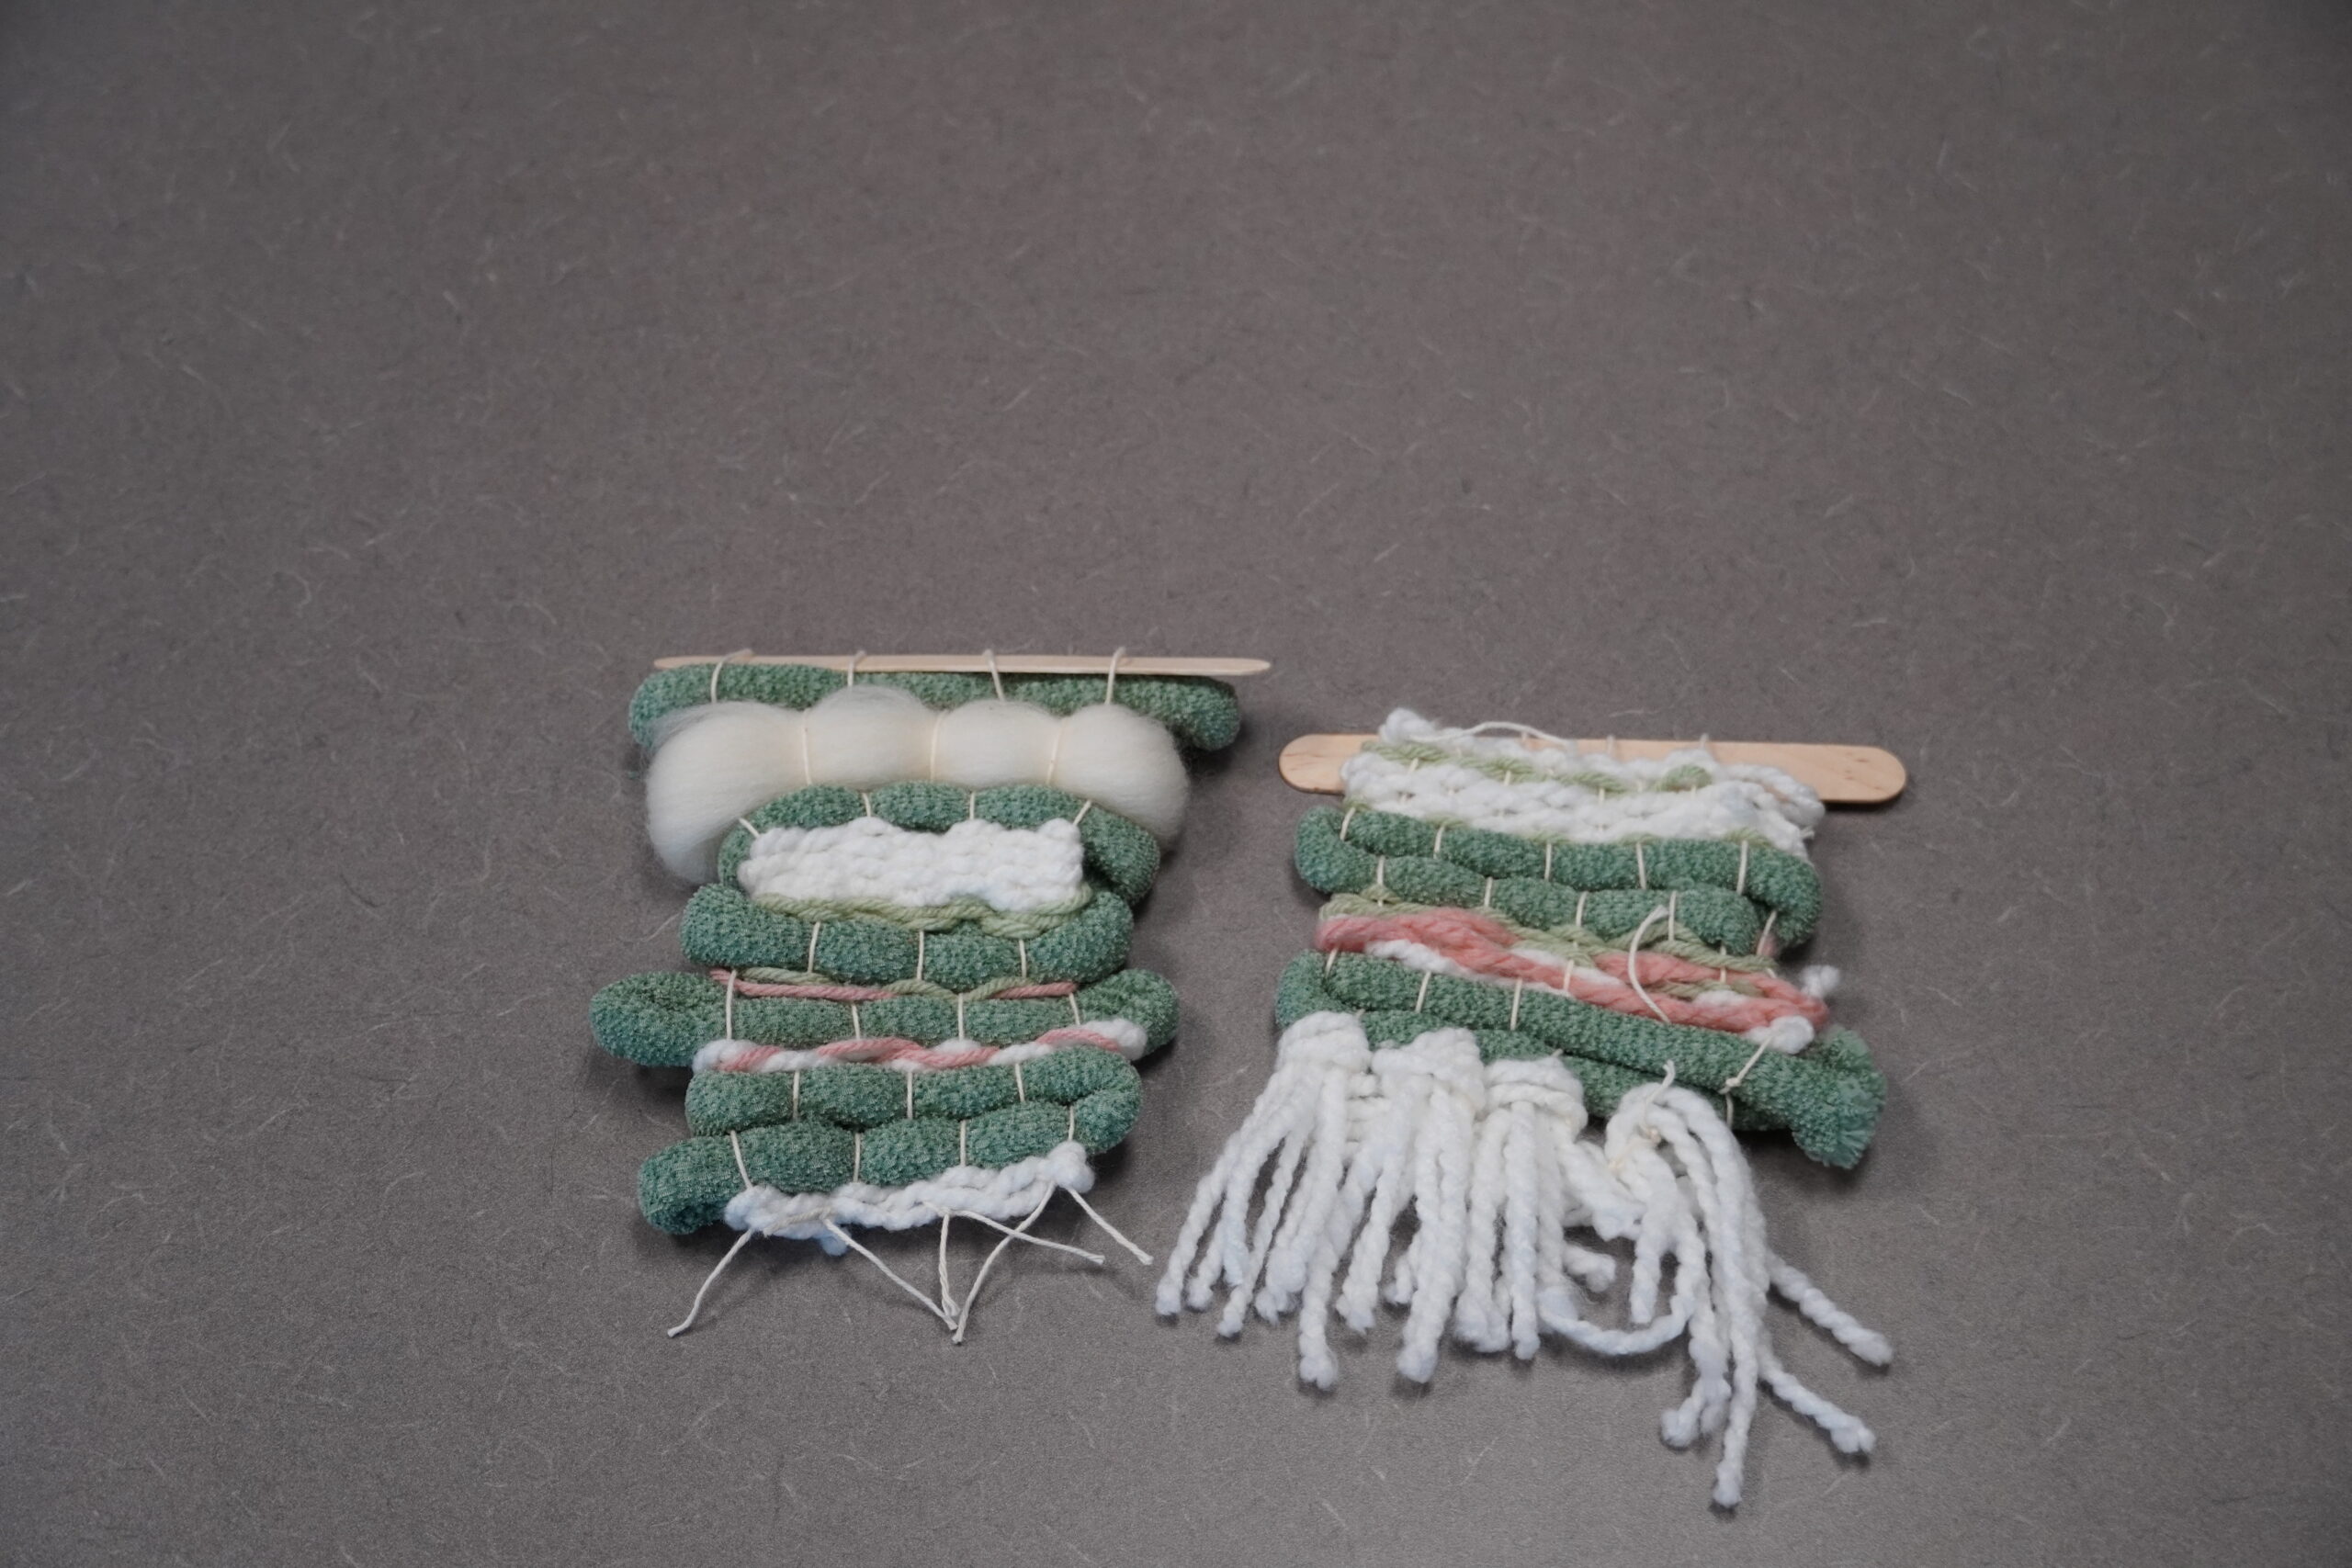
These are two interpretations of the CDC HIV About page. The tapestry on the right uses rya knots for tassels, representing the unchanged features in the footer of the page. Greater emphasis is placed on the modifications to create larger bands of pink.
Works Cited
Bradley, Duncan. “Taking Time Is an Effective Way To Process Large Numbers.” Nightingale (blog), May 31, 2023. https://nightingaledvs.com/time-dimension-in-data-visualization/.
Center for Control and Prevention. “Wayback Machine: About HIV.” Internet Archive Wayback Machine, January 16, 2025. https://web.archive.org/web/diff/20250116033727/20250213010210/https:/www.cdc.gov/hiv/about/index.html.
D’Ignazio, Catherine, and Lauren Klein. “On Rational, Scientific, Objective Viewpoints from Mythical, Imaginary, Impossible Standpoints.” In Data Feminism. MIT Press, 2020. https://doi.org/10.7551/mitpress/11805.001.0001.
Freire, Paulo. Pedagogy of the Oppressed. Translated by Myra Bergman Ramos. New York: Bloomsbury Academic, 2000.
Posner, Miriam. “Humanities Data: A Necessary Contradiction.” Miriam Posner’s BLog (blog), June 25, 2015. https://miriamposner.com/blog/humanities-data-a-necessary-contradiction/.
Russell, John E., and Merinda Kaye Hensley. “Beyond Buttonology: Digital Humanities, Digital Pedagogy, and the ACRL Framework.” College & Research Libraries News 78, no. 11 (December 4, 2017): 588. https://doi.org/10.5860/crln.78.11.588.
Sayers, Jentry. “Low-Tech Approaches to Digital Research.” Presented at the NEH Office of Digital Humanities Institute on Textual Data and Digital Texts in the Undergraduate Classroom, February 26, 2019. https://jentery.github.io/lowtech/#/title.
U.S. National Park Service. “Wayback Machine: Stonewall National Monument.” Internet Archive Wayback Machine, January 19, 2025. https://web.archive.org/web/diff/20250119000200/20250215002842/https://www.nps.gov/ston/index.htm.
Walsh, Brandon. “‘The Three-Speed Problem in Digital Humanities Pedagogy’ in ‘What We Teach When We Teach DH.’” In What We Teach When We Teach DH, edited by Brian Croxall and Diane K. Jakacki. Debates in the Digital Humanities 10. University of Minnesota Press, 2023. https://doi.org/10.5749/9781452969558.
Wernimont, Jacqueline. “A Gather: Documenting Death.” Jacqueline Wernimont: Researching Data from Bodies and Data Flows (blog), March 24, 2022. https://jwernimont.com/a-gather-documenting-death/.
Kaylen Dwyer
Kaylen Dwyer is the Digital Humanities Librarian at Tufts University where she provides support for a wide range of digital humanities projects, including digital exhibits, digital editions, mapping, and multimodal storytelling in research and pedagogy. Her research interests are critical making, creative coding, and disability and access in DH.