Introduction
Data visualizations—and, by extension, data physicalizations—often make data more accessible visually. Colour-coded graphs and flow charts with graphics and arrows can be easier and quicker to read at a glance than a long table of data or numbers and percentages hidden within long prose. Wearing that data as a scarf is also visually appealing, and it makes for a great conversation starter about the work. Although these graphs and charts can make data more accessible for sighted audiences, they often make data less accessible for visually impaired audiences, as the details of some data visualizations can be difficult to describe in alt text, and alt text often is not used or difficult to access in many publications. (For information on how to make data visualizations more accessible, consult Chartability.) Due to their inherent tactile nature, there is an opportunity to make data physicalizations more accessible than their flat, digital counterparts.
To take examples from the previous special edition featuring data physicalizations, the woven emotional bookmarks, the data ball, and the porcelain Me & You project all resulted in physical, tactile objects that one could hold or display on a shelf or their self (in the case of wearable projects). Though these projects are tactile, they still largely rely on the sense of sight to be interpreted. As I read the 2024 special issue, I began to think about how we could take data physicalizations a step further to be accessible to people who are blind or visually impaired by using the advantages of the tactile nature of the crafted data. Though I have never considered myself an artist, I did pick up a craft during the lockdowns of 2020 (as many other people did), and I began to crochet. As I became more comfortable with my craft, I began to accumulate what fibre arts folks describe as a yarn stash. My stash takes up the entire closet in my home office, and as I studied my stash, I contemplated how I could use the variety of yarn I had available to create something beautiful, informative, and accessible tactilely and visually. Yarn is a wonderful material because it comes in so many different colours, weights (thickness), and textures, and, because of its versatility, it can be used for a wide variety of crafts and projects.
The goal of this woven tactile pie chart project is to make data accessible to sighted and visually impaired audiences. By using a combination of yarn colour and weight, the pie charts are completely legible by sight and by touch. Adding braille data labels makes the data even more accessible to people with visual impairments. For the samples used in the pattern tutorial below, I used data from the 2023 Statistics Canada report on Print Material Accessibility. According to this report, 5.2 million people in Canada report difficulty reading print materials. The weave that illustrates the tutorial below uses the statistic from this report that 77% of those 5.2 million people have difficulty seeing words in print. I used additional data from this report for more woven pieces, which I then sewed together to make a larger tapestry of data.
The pattern is specifically designed for percentage charts with two values. This pattern will not work as effectively for pie charts that include more than two values, as it would become more difficult to feel the difference between weights of yarn if there is a more gradual change (from 4-weight to 5-weight to 6-weight, for example) rather than the stark difference used in the sample (from 4-weight to 6-weight). Multiple data points may work better if additional textures of yarn are used, rather than simply relying on the thickness, but it is possible that more data points would still make it more difficult to read tactilely than the speed of visually seeing the different colours used. Therefore, the pattern is most effective for charts with two labels.
For the data labels, I am using unified English braille (UEB, which is the most commonly used variation of English braille worldwide), and I chose to use uncontracted braille, or grade 1 UEB. Using uncontracted braille means that every braille character stands for a letter in the visual alphabet (with exceptions for some punctuation marks that require two characters); contracted braille has short hands—or, more simply, contractions—that help to shorten the text. Contractions can be a single character for a whole word (the ⠮), a single character for a letter formation (ar ⠜), or multiple characters for a single word (braille ⠃⠗⠇). Typically, braille readers will learn the uncontracted alphabet before learning the contractions, so using uncontracted braille for the data labels makes it more accessible to a wider braille-reading audience—it also makes it more accessible for people who do not read braille to add the braille labels, as contracted braille has a lot of complicated rules.
The tutorial below discusses how this project was possible, so I now want to discuss why this project is important—why making data accessible is important. One of my favourite books about data is Data Feminism by Catherine D’Ignazio and Lauren F. Klein (2020). In their chapter called “What Gets Counted Counts,” D’Ignazio and Klein discuss how being counted in data—or, conversely, not being counted—matters significantly in terms of political, cultural, and economic representation. Though the chapter focuses on gender representation in data (such as census data, among others), the intersectional feminist perspective with which the entire book is written concludes that all types of diverse data are important to ensure accurate, ethical data (and data representation). My research overall focuses on accessibility and representations of disability, so ethical data collection and representation are core focuses for my work. As an extension to that, accessible reproductions—including visualizations and physicalizations, as well as the inclusion of alt text and captions—of data are also vitally important to ensure research is being communicated ethically to diverse audiences. It is not enough to count diverse data if that data is not then disseminated and represented accessibly and ethically.
In this same chapter, D’Ignazio and Klein argue that “the absence of data becomes an important takeaway, as meaningful as the data themselves” (D’Ignazio and Klein 2020, 113). In this quote, they are referring to nonexistent data, such as that of nonbinary and genderqueer people when the only gender choices on a form are “male” and “female,” but their argument stands for the lack of accessibility to data as well. The absence of ethically, accessibly disseminated data has meaning for the audiences who are unable to access that information. Data physicalizations are, of course, only accessible by the people who are physically able to access them in the space where they exist, but they should be fully accessible to all audiences who are present in that space. As D’Ignazio and Klein say, what gets counted counts; being able to access what has been counted counts, too.
The pattern below will guide you in creating your own tactile pie charts, including brief instructions on adding braille data labels. It is okay if you do not know how to read braille; you can still add braille data labels. Figure 1 has the basic UEB alphabet and numbers. To use a capital letter, use the capital letter indicator before the letter you want capitalized. To capitalize a whole word, use the indicator twice, and to capitalize a whole passage, use it three times and then put the capital terminator indicator at the end of the affected passage. To use a number, put the numerical indicator before the braille character you want to read as a number (note that this is not the same as the character #, which has its own braille character). The numerical indicator persists until a space. If you want a combination of letters and numbers, use the grade 1 indicator or the capital letter indicator before the characters you want to read as letters (52e = ⠼⠑⠃⠰⠑ or 52E = ⠼⠑⠃⠠⠑).
| ⠁ a 1 | ⠃ b 2 | ⠉ c 3 | ⠙ d 4 | ⠑ e 5 | ⠋ f 6 | ⠛ g 7 | ⠓ h 8 | ⠊ i 9 | ⠚ j 0 |
| ⠅ k | ⠇ l | ⠍ m | ⠝ n | ⠕ o | ⠏ p | ⠟ q | ⠗ r | ⠎ s | ⠞ t |
| ⠥ u | ⠧ v | ⠺ w | ⠭ x | ⠽ y | ⠵ z | ⠈⠣ ( | ⠈⠜ ) | ⠄ ‘ | ⠖ ! |
| ⠦ “
(opening double quote mark) |
⠴ ”
(closing double quote mark) |
⠲ .
(period) |
⠠ (capital letter indicator) | ⠠⠄
(capital terminator indicator) |
⠼ (numerical indicator) | ⠰
(grade 1 indicator) |
⠨⠴ % |
Figure 1: The unified English braille alphabet, including some punctuation marks.
Materials
- A handheld loom—any shape will work as long as it is a notched loom, not a pin loom, but I used a hexiloom
- A loom comb
- A pick-up stick
- A darning needle and a long weaving needle—you could just use one or the other, but I find having two is often useful
- Yarn scissors
- A 4-weight yarn and a 6-weight yarn in different colours
- Cardstock business card size paper
- A braille slate and stylus—I used a business card size slate that fits the paper, but any size slate will work with some adjustments

Figure 2: Materials required for the weave, excluding the braille slates for labelling.
Pattern
If you would prefer a visual tutorial on how to use this type of loom, the maker of the loom I used made a video tutorial on YouTube.
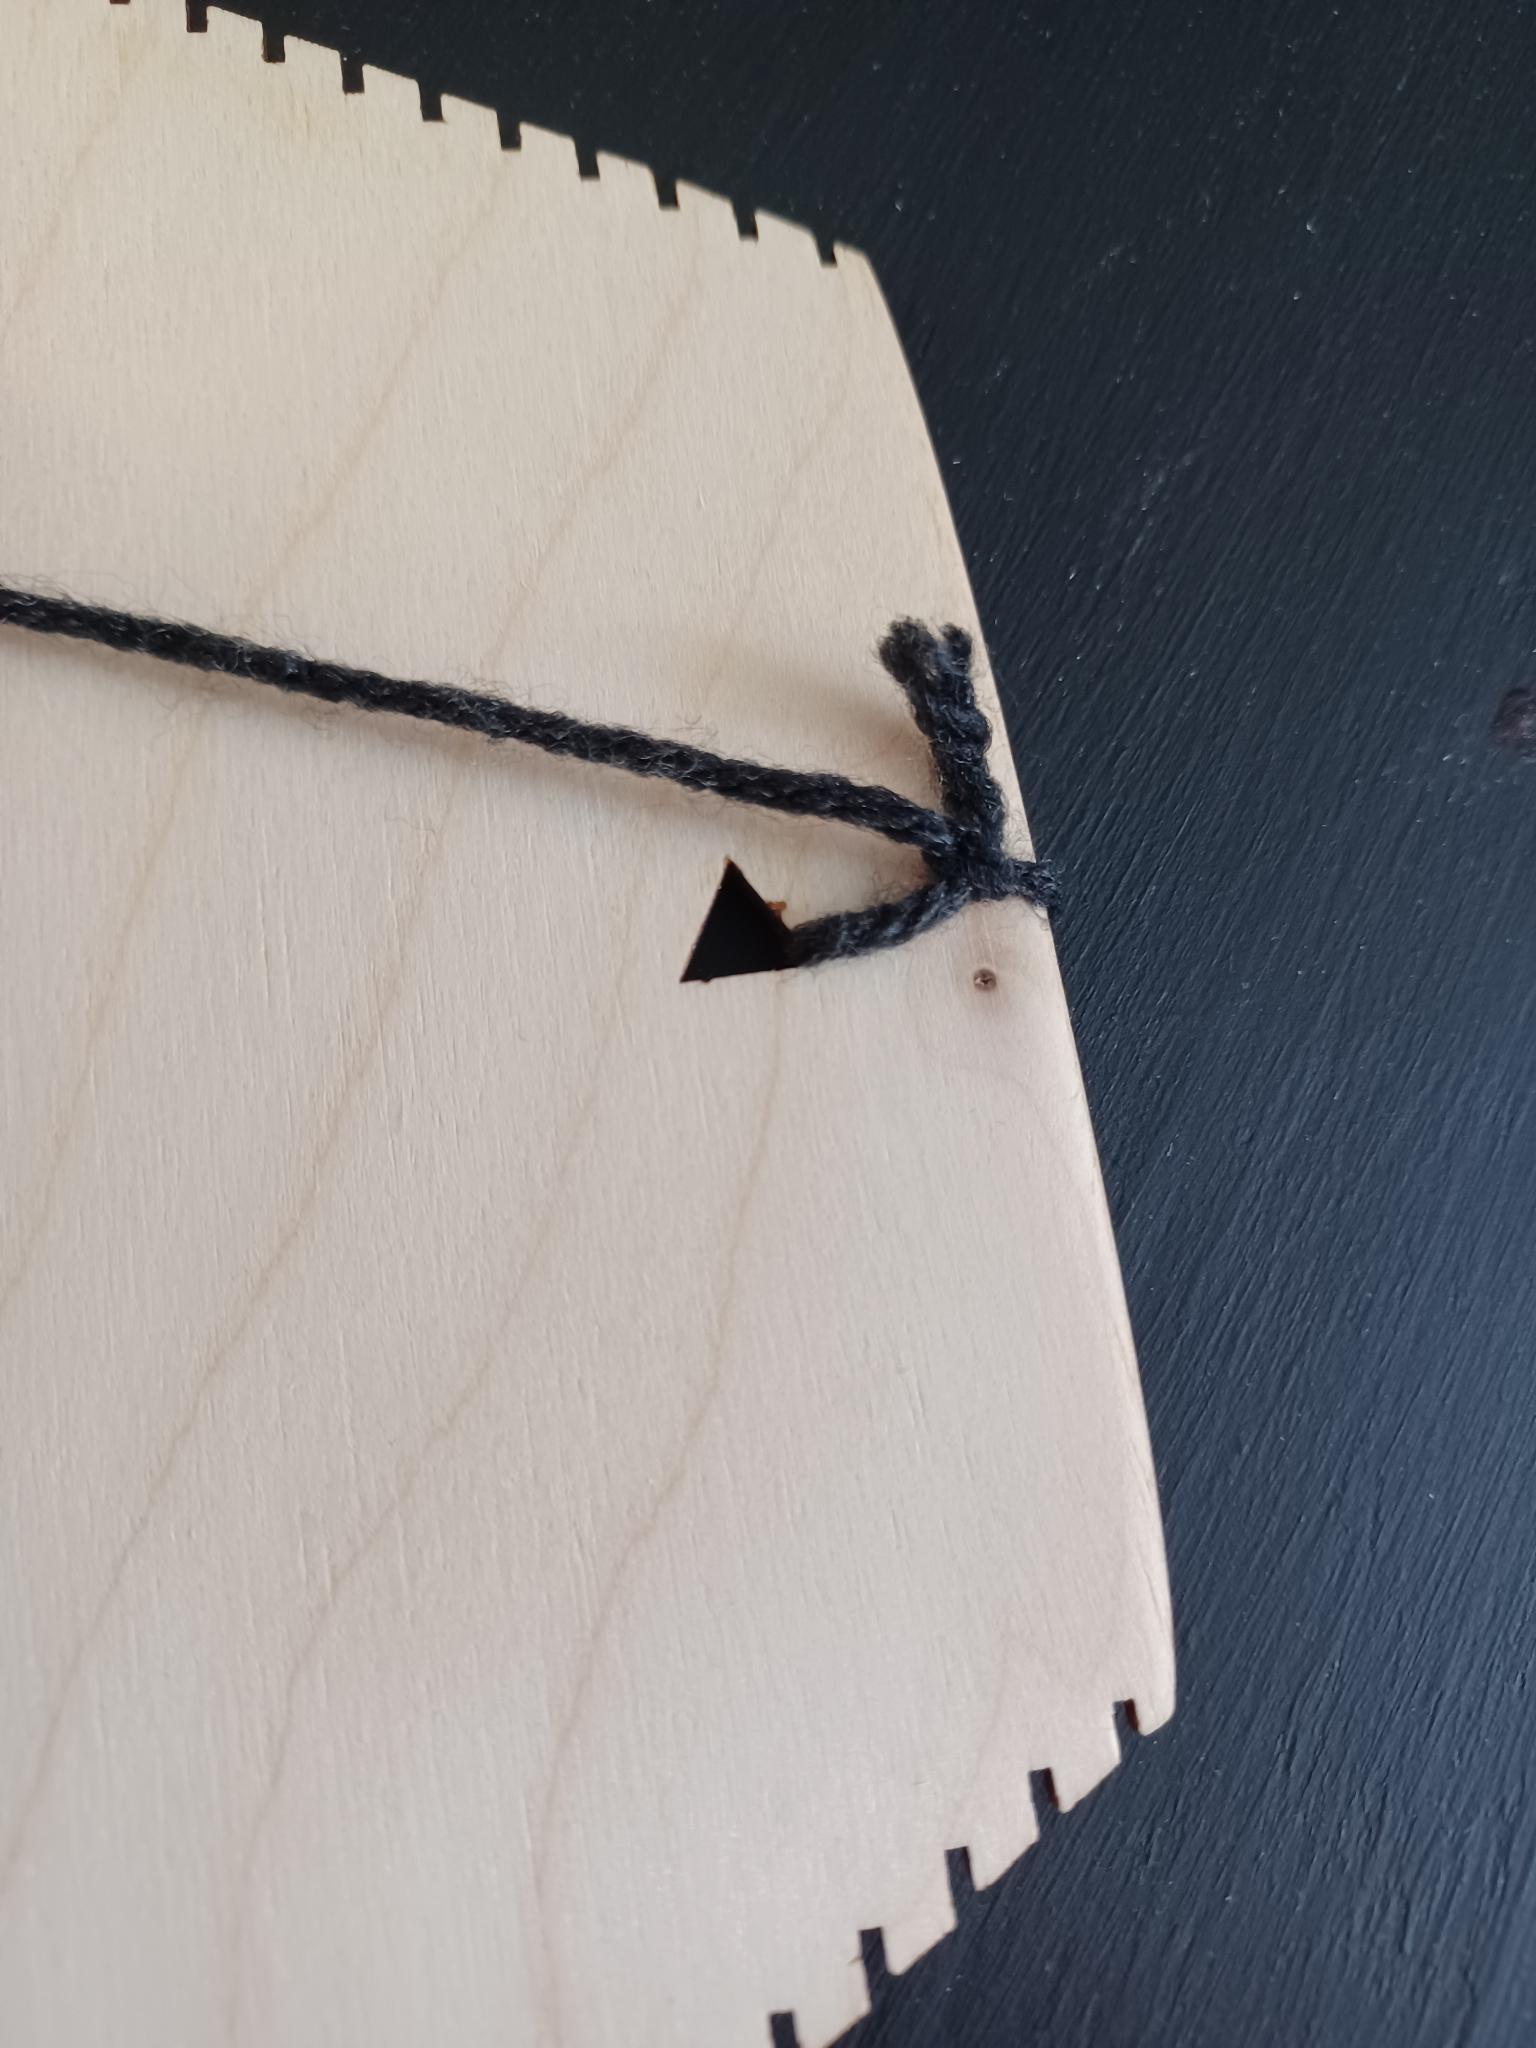
- Tie your 4-weight yarn to one side of the loom. Make sure the knot is snug, and leave yourself enough yarn on the end to easily sew it in at the end. (Leave more than I did in Figure 3, as I found mine too short to sew in easily.)
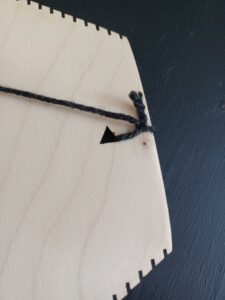
Figure 3: How to tie your warp layer onto the loom.
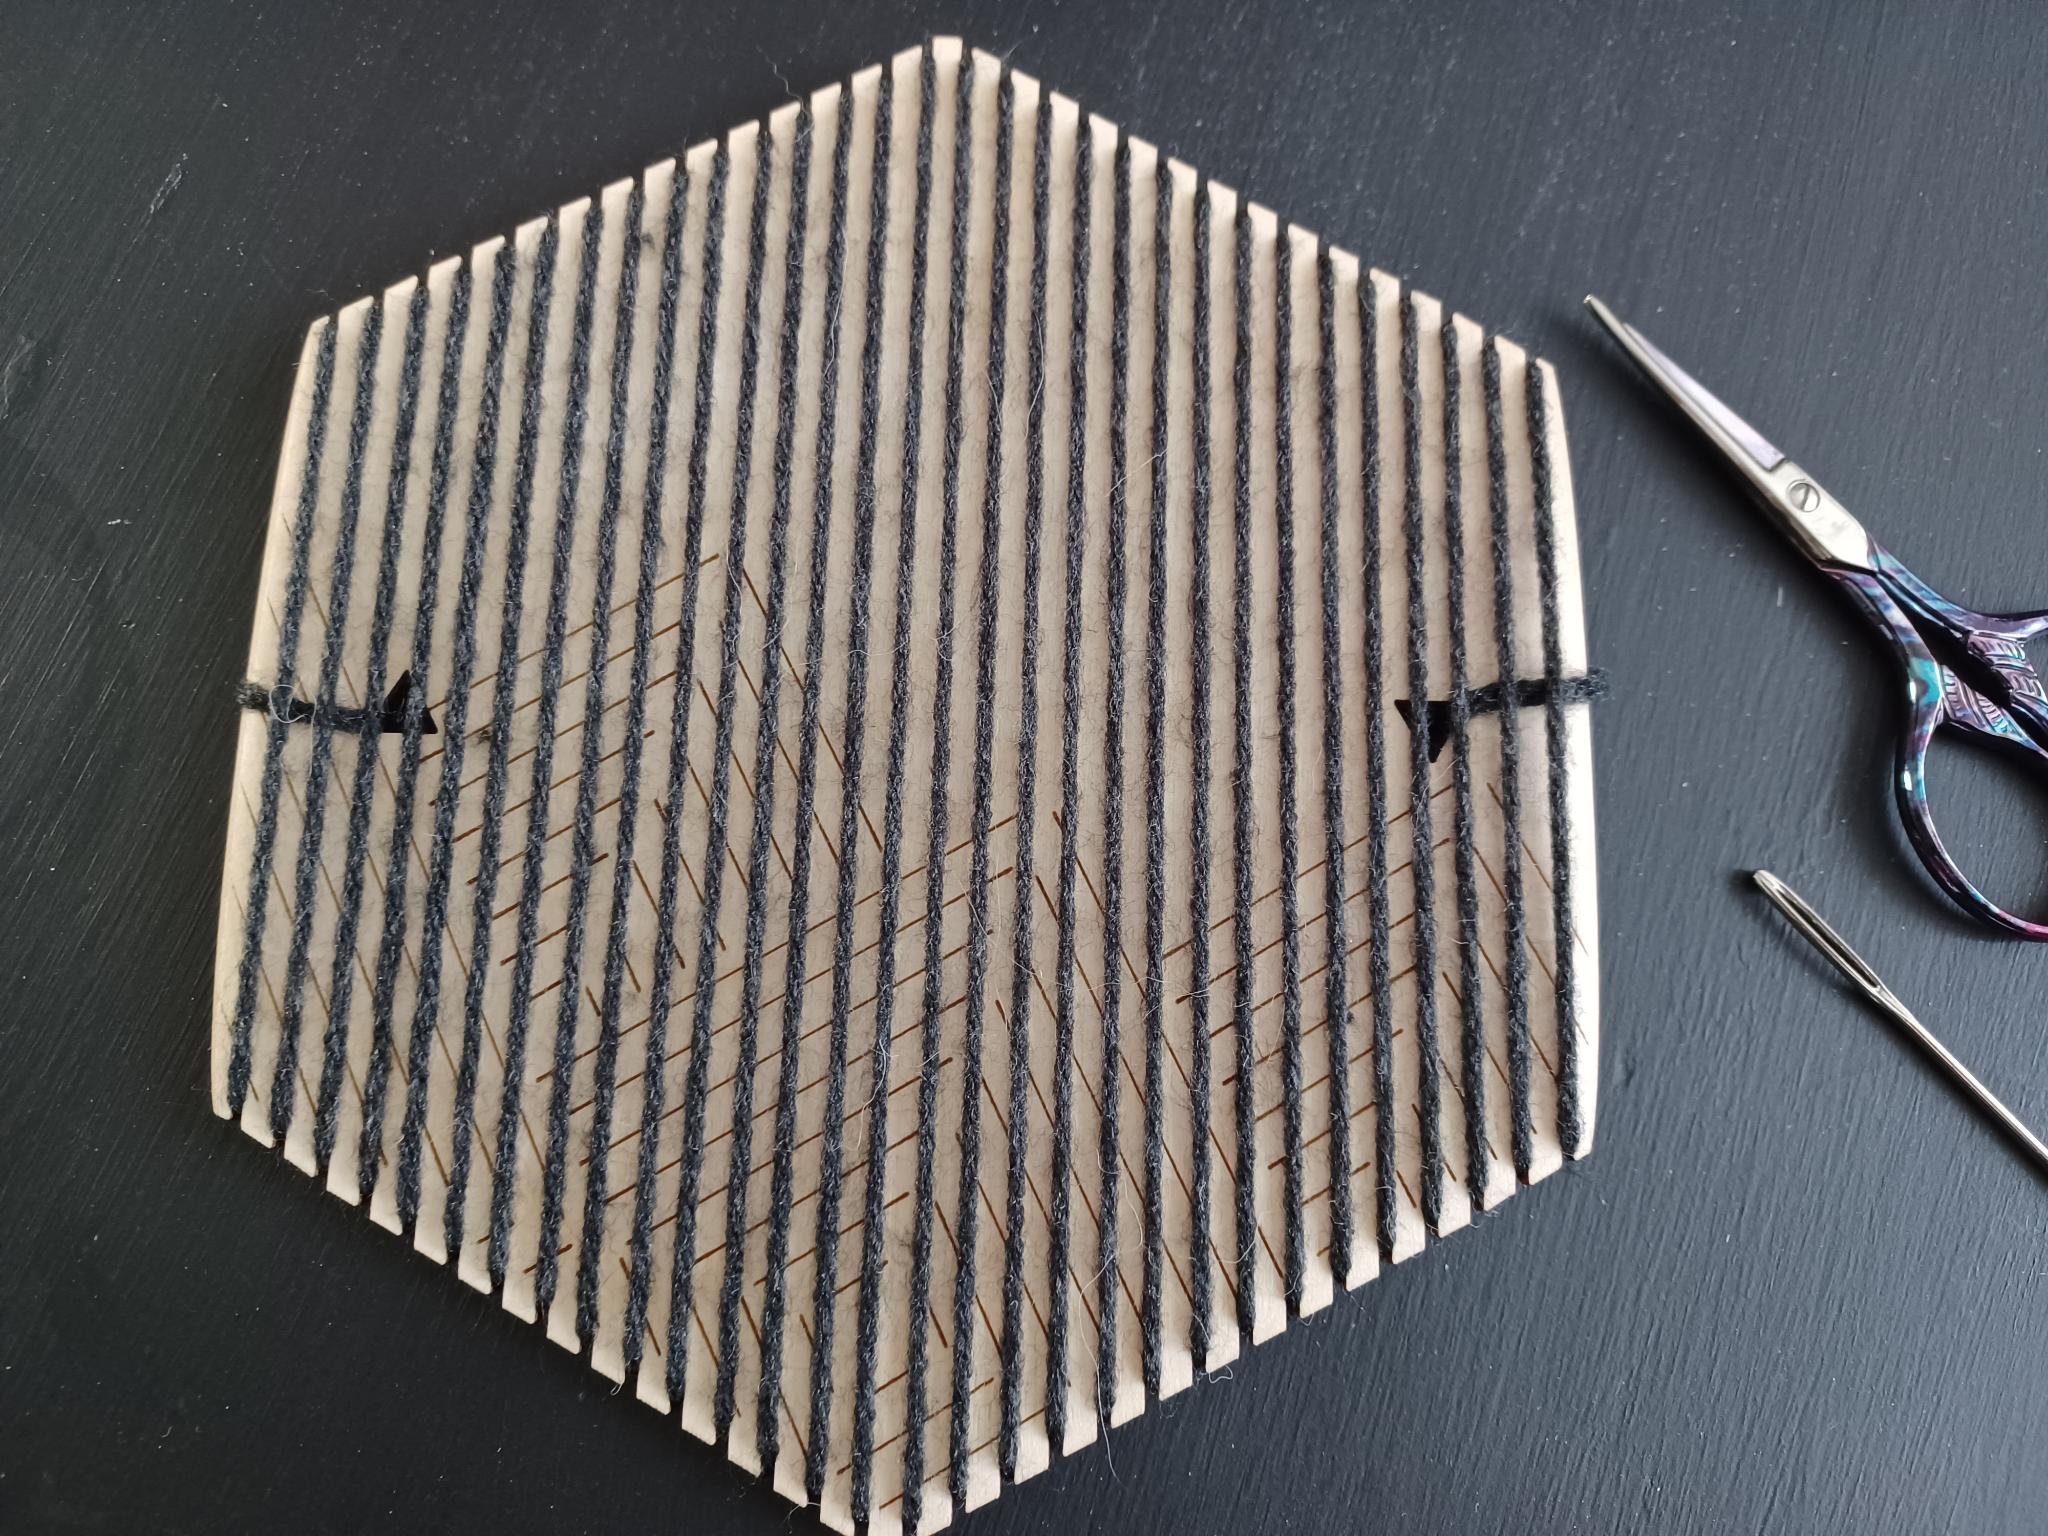
- Create the warp layer on the front of your loom. Wrap the yarn around the notches at the top and bottom of the loom. The strands should only be on one side of the loom, as shown in Figures 4 and 5.
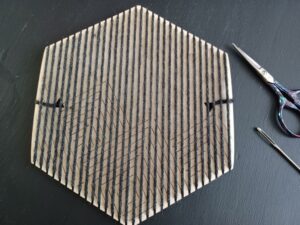
Figure 4: The front of the loom with the warp layer completed.
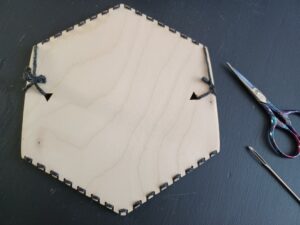
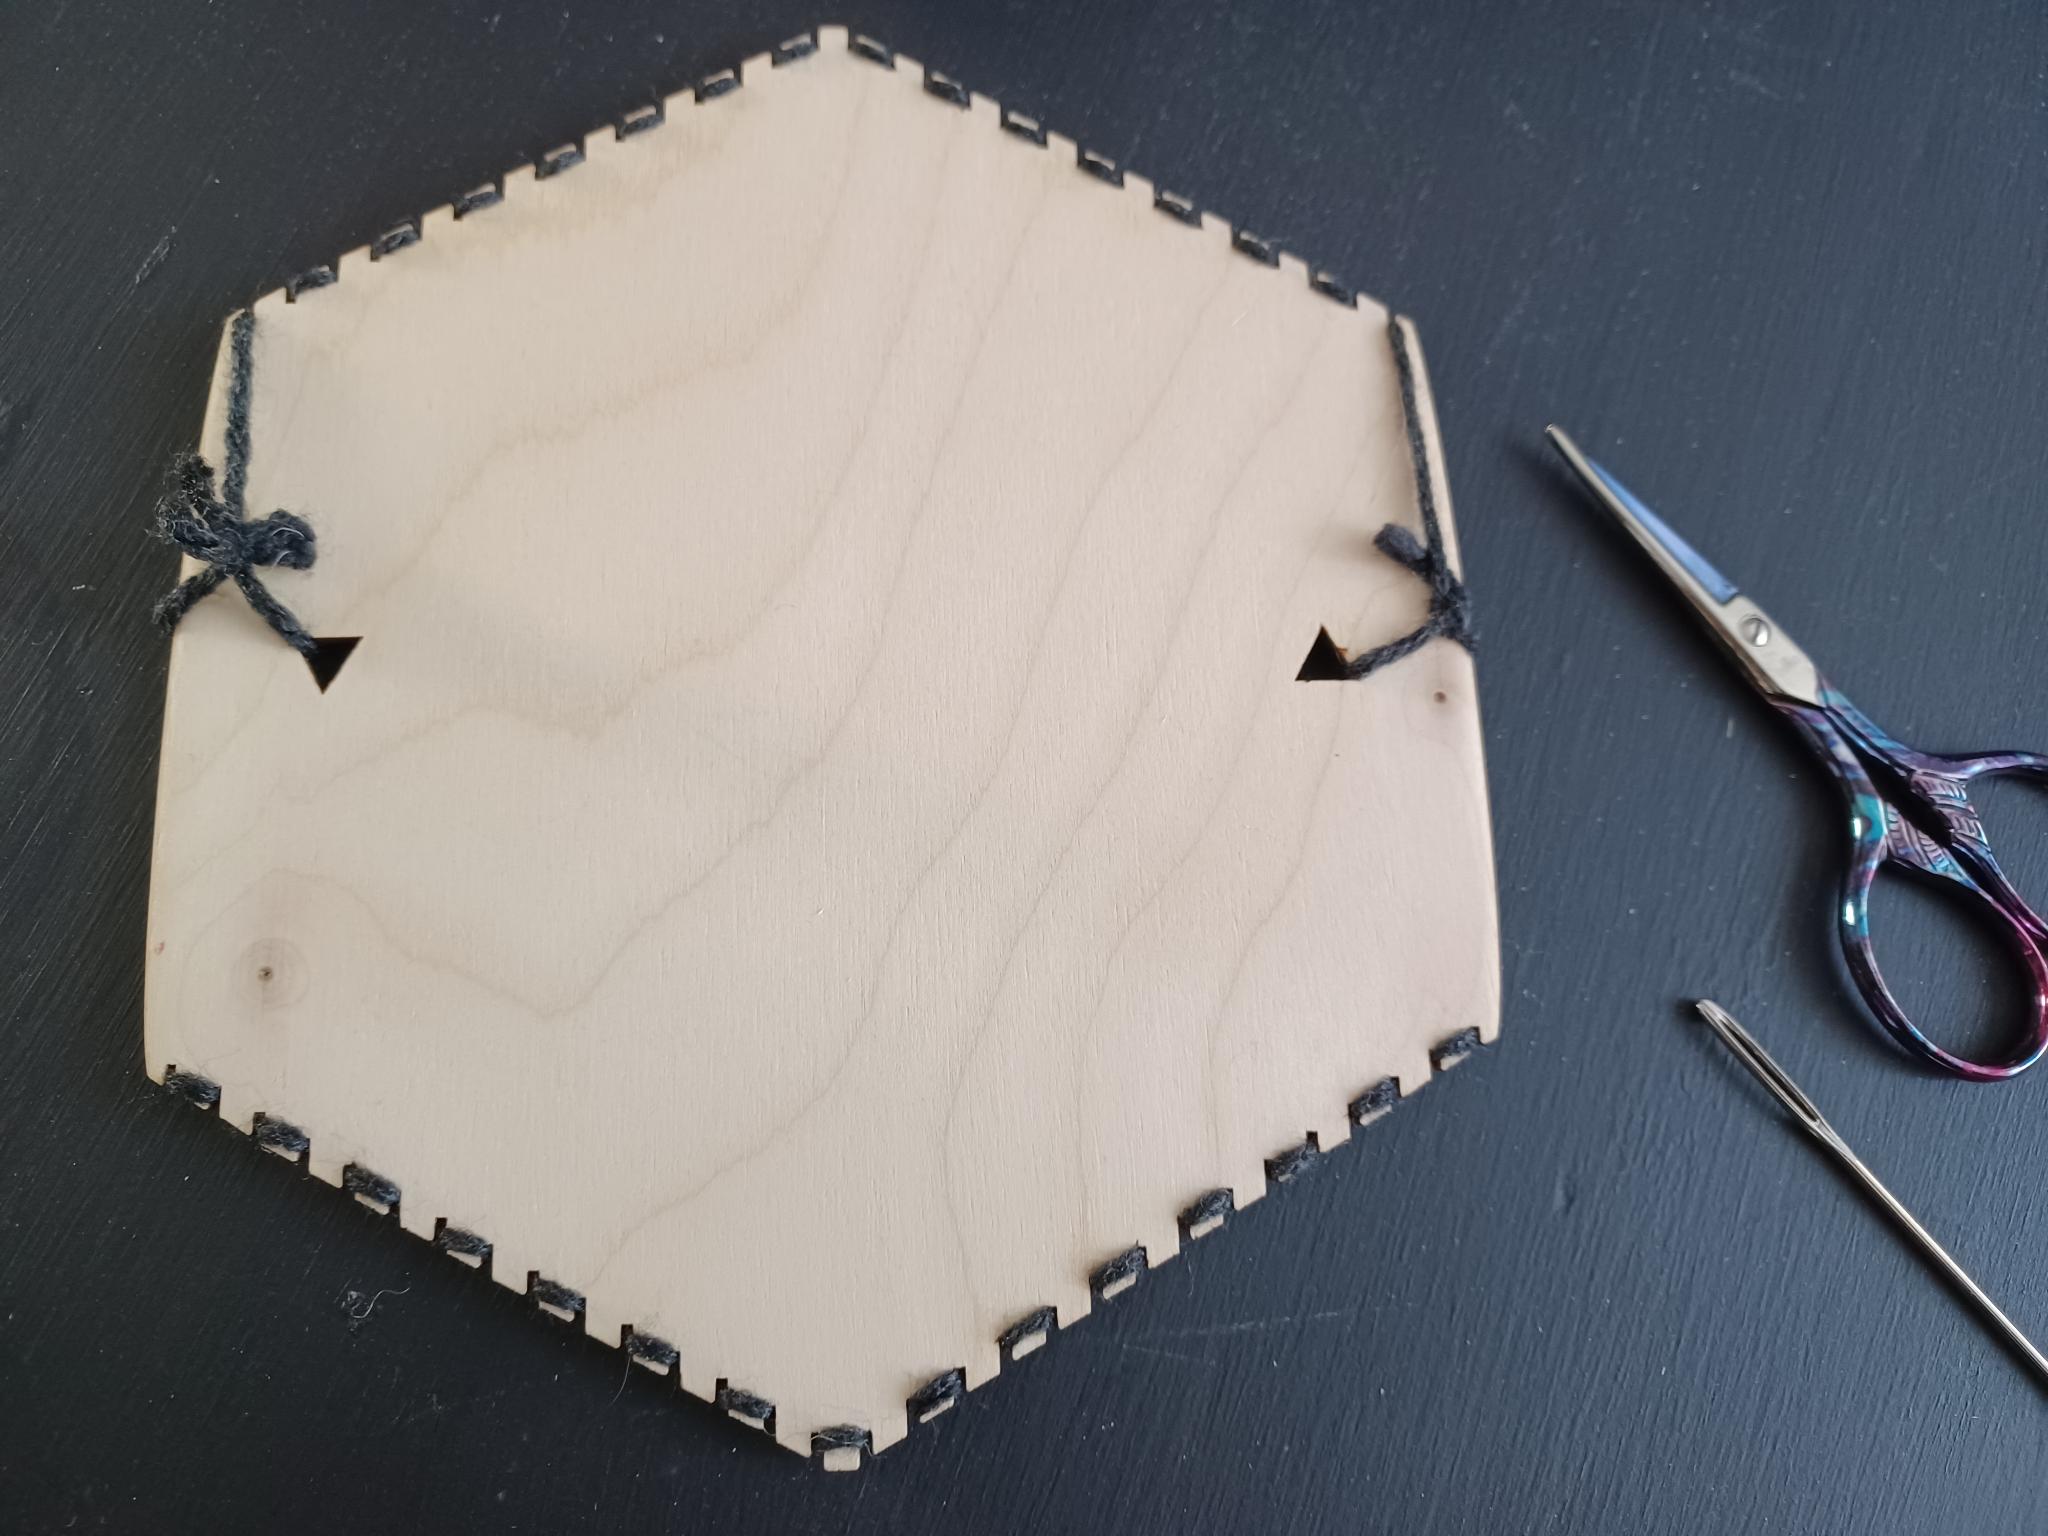
Figure 5: The back of the loom with the warp layer completed.
- When you finish the warp layer, tie the end of your yarn in the same way you did at the beginning. Make sure it is snug, as having the end loose can create problems as you weave. (I had to retie mine partway through making this sample, as it was too loose and it started to fall off the last two notches as I was weaving.)
- Now using the 6-weight yarn, cut the amount you need from the skein. You need to weave the whole amount through the loom on every row, so you cannot use a full skein. Roughly layer your yarn over the loom to estimate how much you will need. If you have too much, you can cut off the remainder at the end. If you do not have enough, you can tie another piece on to continue weaving. (I recommend the magic knot. I used this method, and it’s impossible to tell that there is a knot in my work after it was completed.)
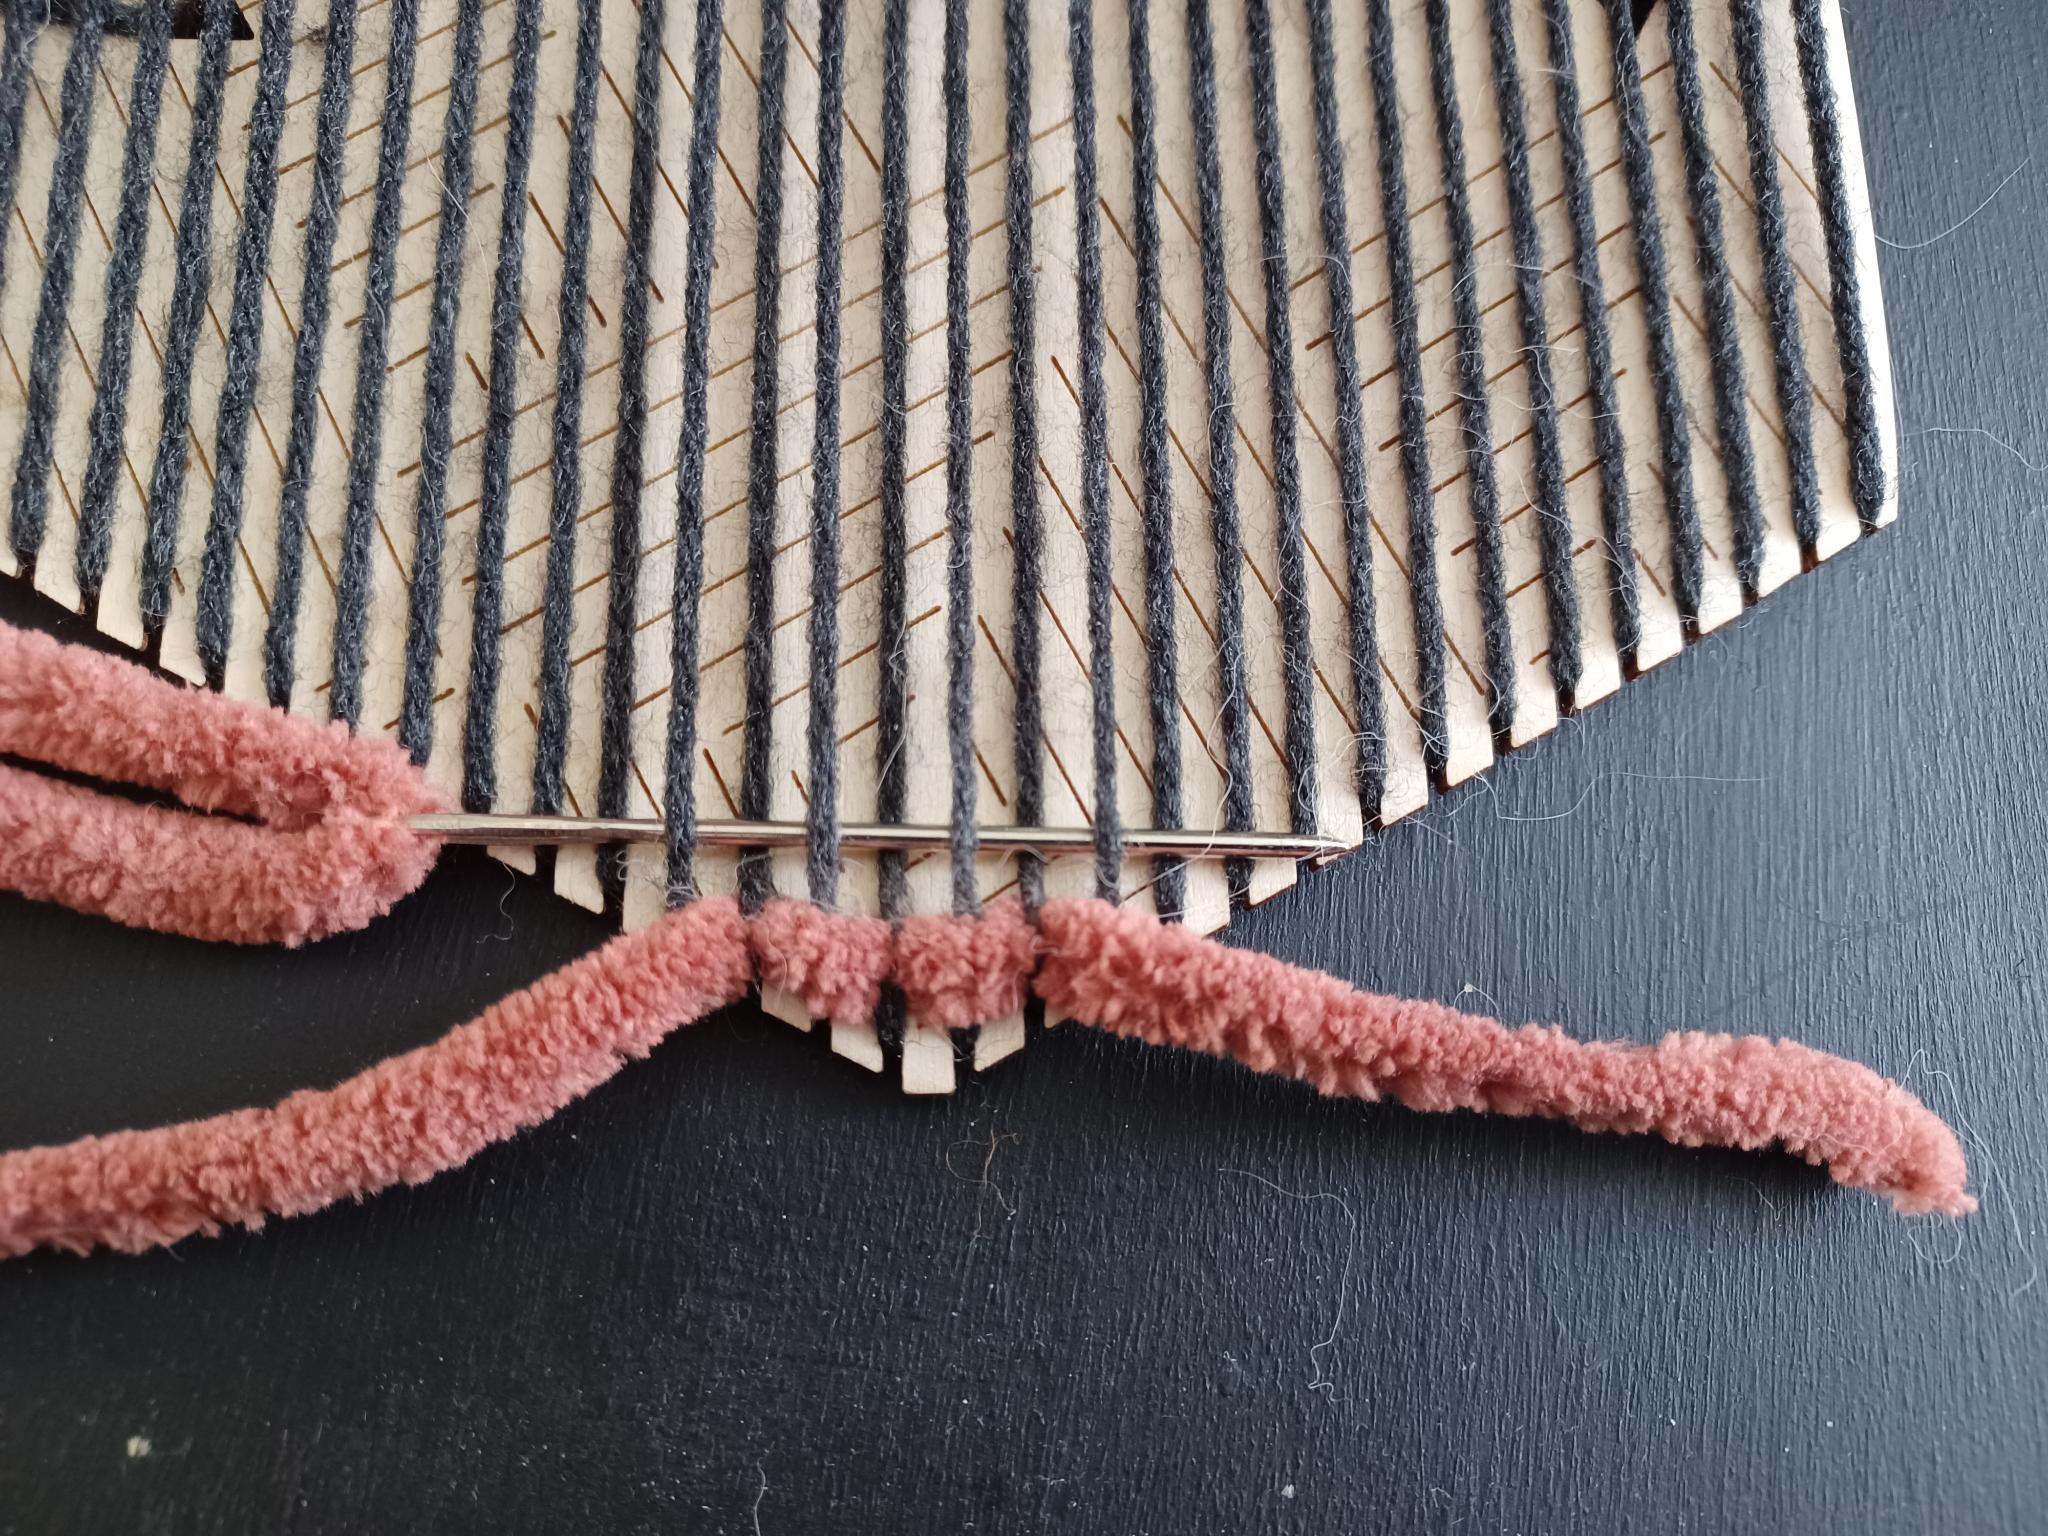
- Thread the yarn into the darning needle and begin your weave. For the hexiloom, start with the bottom five warp strands, as shown in Figure 6. Weave by moving your needle below a warp strand, then above the next one, then below the next one, and so on. Leave yourself a long enough tail to sew in at the end. (Again, I recommend leaving a longer tail than shown in Figure X, as mine was too short to easily sew in at the end.)
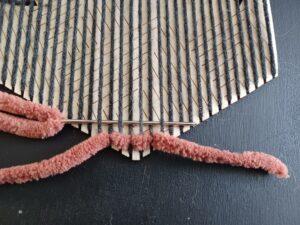
Figure 6: The beginning of the weave with the 6-weight yarn and a tail to sew in.
- Weave the next layer by alternating which warp strands you are going above/below, adding a strand on either side to start working up the sides of the hexiloom. (If you are using a square loom, you will start by working the full width of the loom.)
- At this point, you may want to start using the pick-up stick. Place the stick under the warp layer along the full width of the loom. This helps to pick up the work so it is easier to weave. If your warp is tight and it is difficult to move the pick-up stick into place, using the long weaving needle to lift the warp.
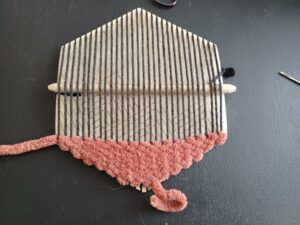
Figure 7: There are a few rows completed now, and the pick-up stick is underneath the warp.
- Continue this pattern, working back and forth along the loom and increasing the number of strands you work with until you are using the full width of the loom. Use the comb after each layer to tighten the new layer against the previous layers so there are no gaps in your work. If you wish, you can thread your yarn onto the longer weaving needle so you can weave longer sections on each layer. I used my darning needle for the entire weave, as the eye of my weaving needle was not big enough for the 6-weight yarn.
- The rest of the pattern will vary depending on the numerical value of the data you are weaving. I am weaving 77%, so I am using the 6-weight yarn to take up approximately 77% of the loom surface. Adjust accordingly to the value of your data.
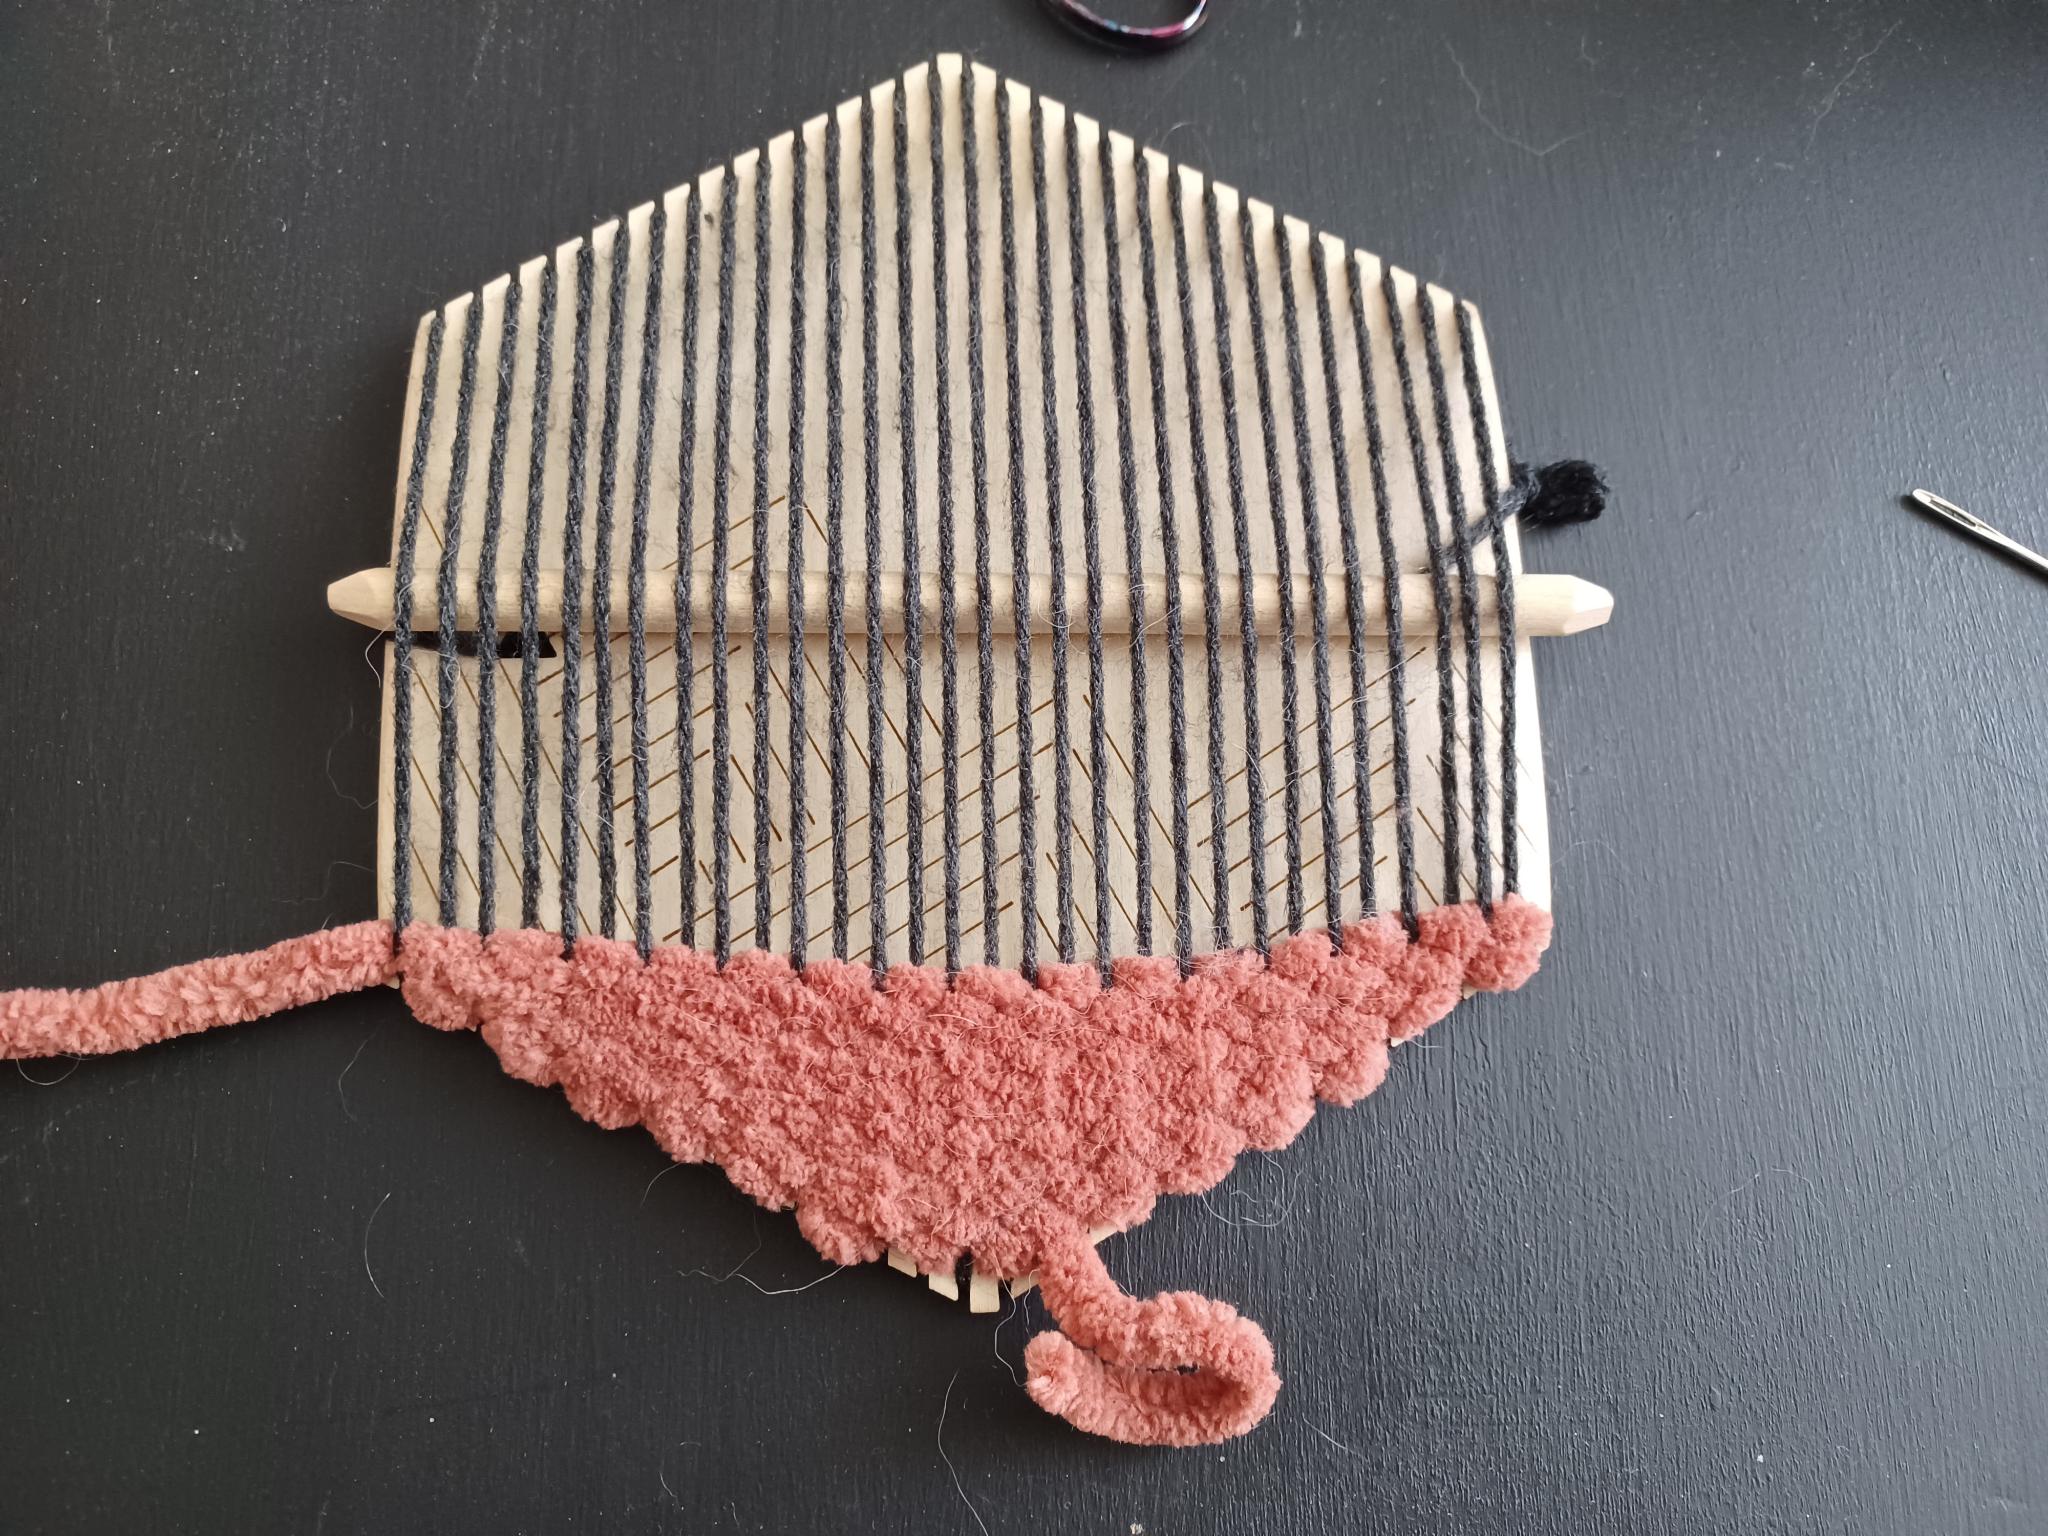
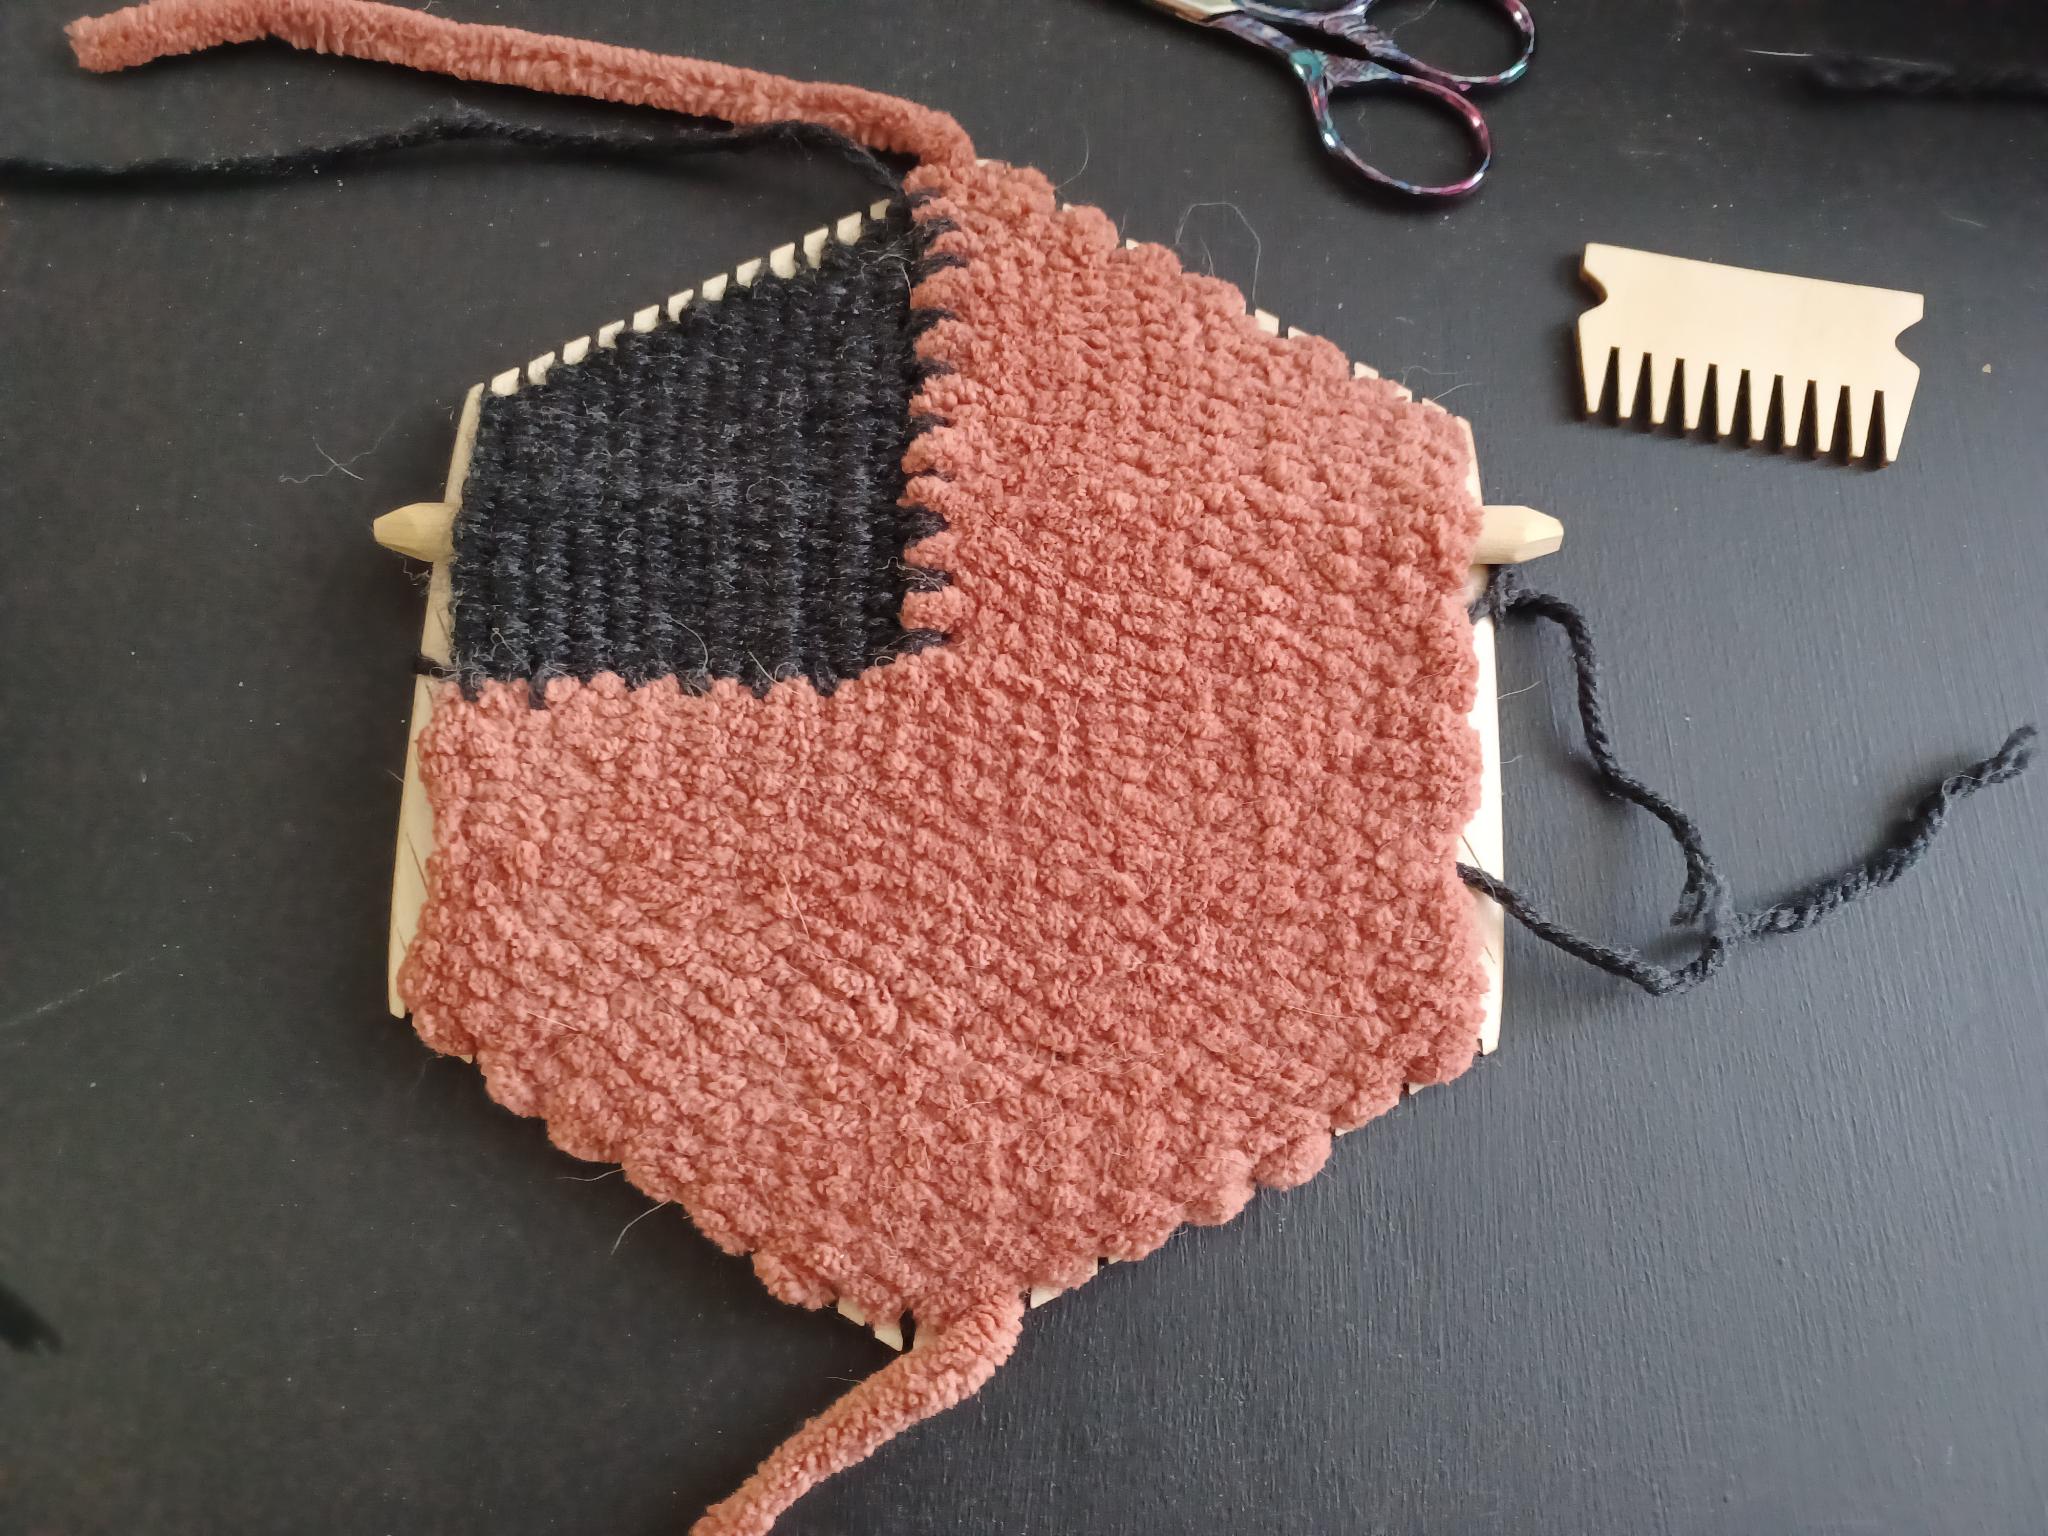
- Figure 8 shows approximately 50% of the loom woven with the 6-weight yarn. Since I am creating a pie chart, I will no longer weave the full length of the loom after this point. To create the effect of 27% on the top half of the weave, my next layers will be slightly longer than halfway across the width of the loom. Figure 9 shows the length of the remaining layers. Continue the back and forth weave pattern until you reach the top of the loom, then begin to reduce the number of warp strands you weave with to get to the top tip of the hexiloom.
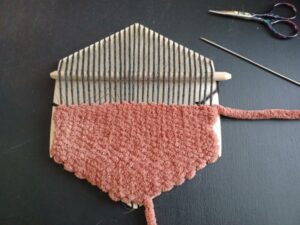
Figure 8: Half of the weave is completed with the 6-weight yarn.
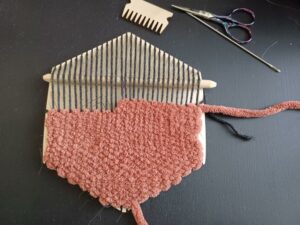
Figure 9: Half of the weave is completed, plus a few rows to slightly past halfway across the loom to simulate the remaining 27%.
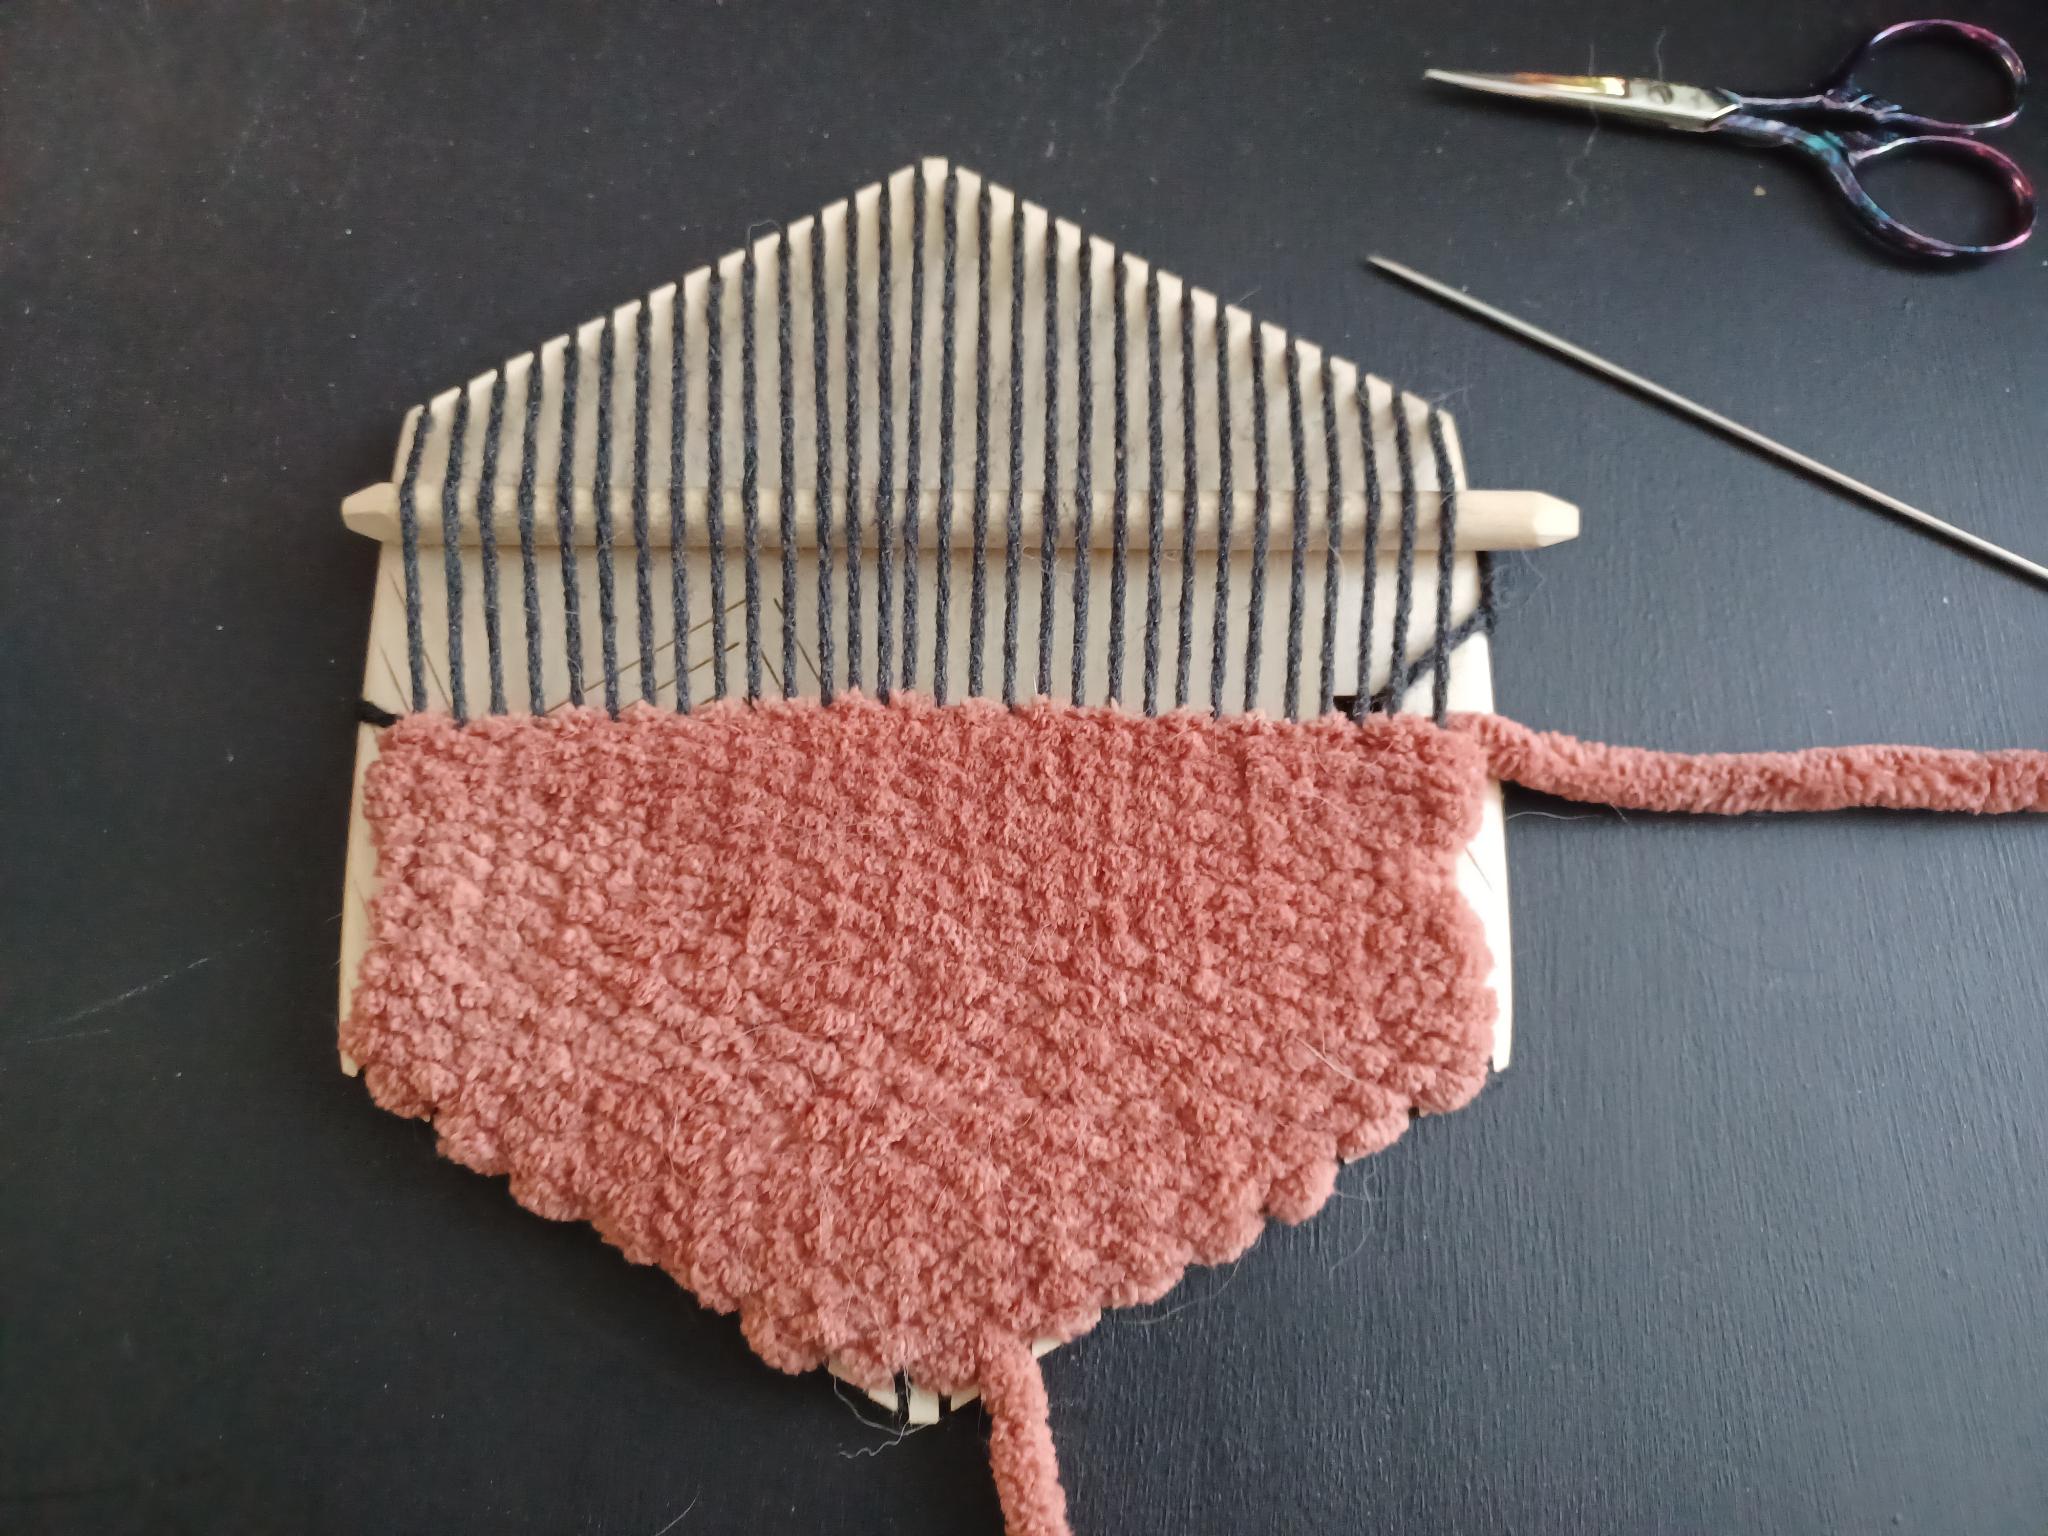
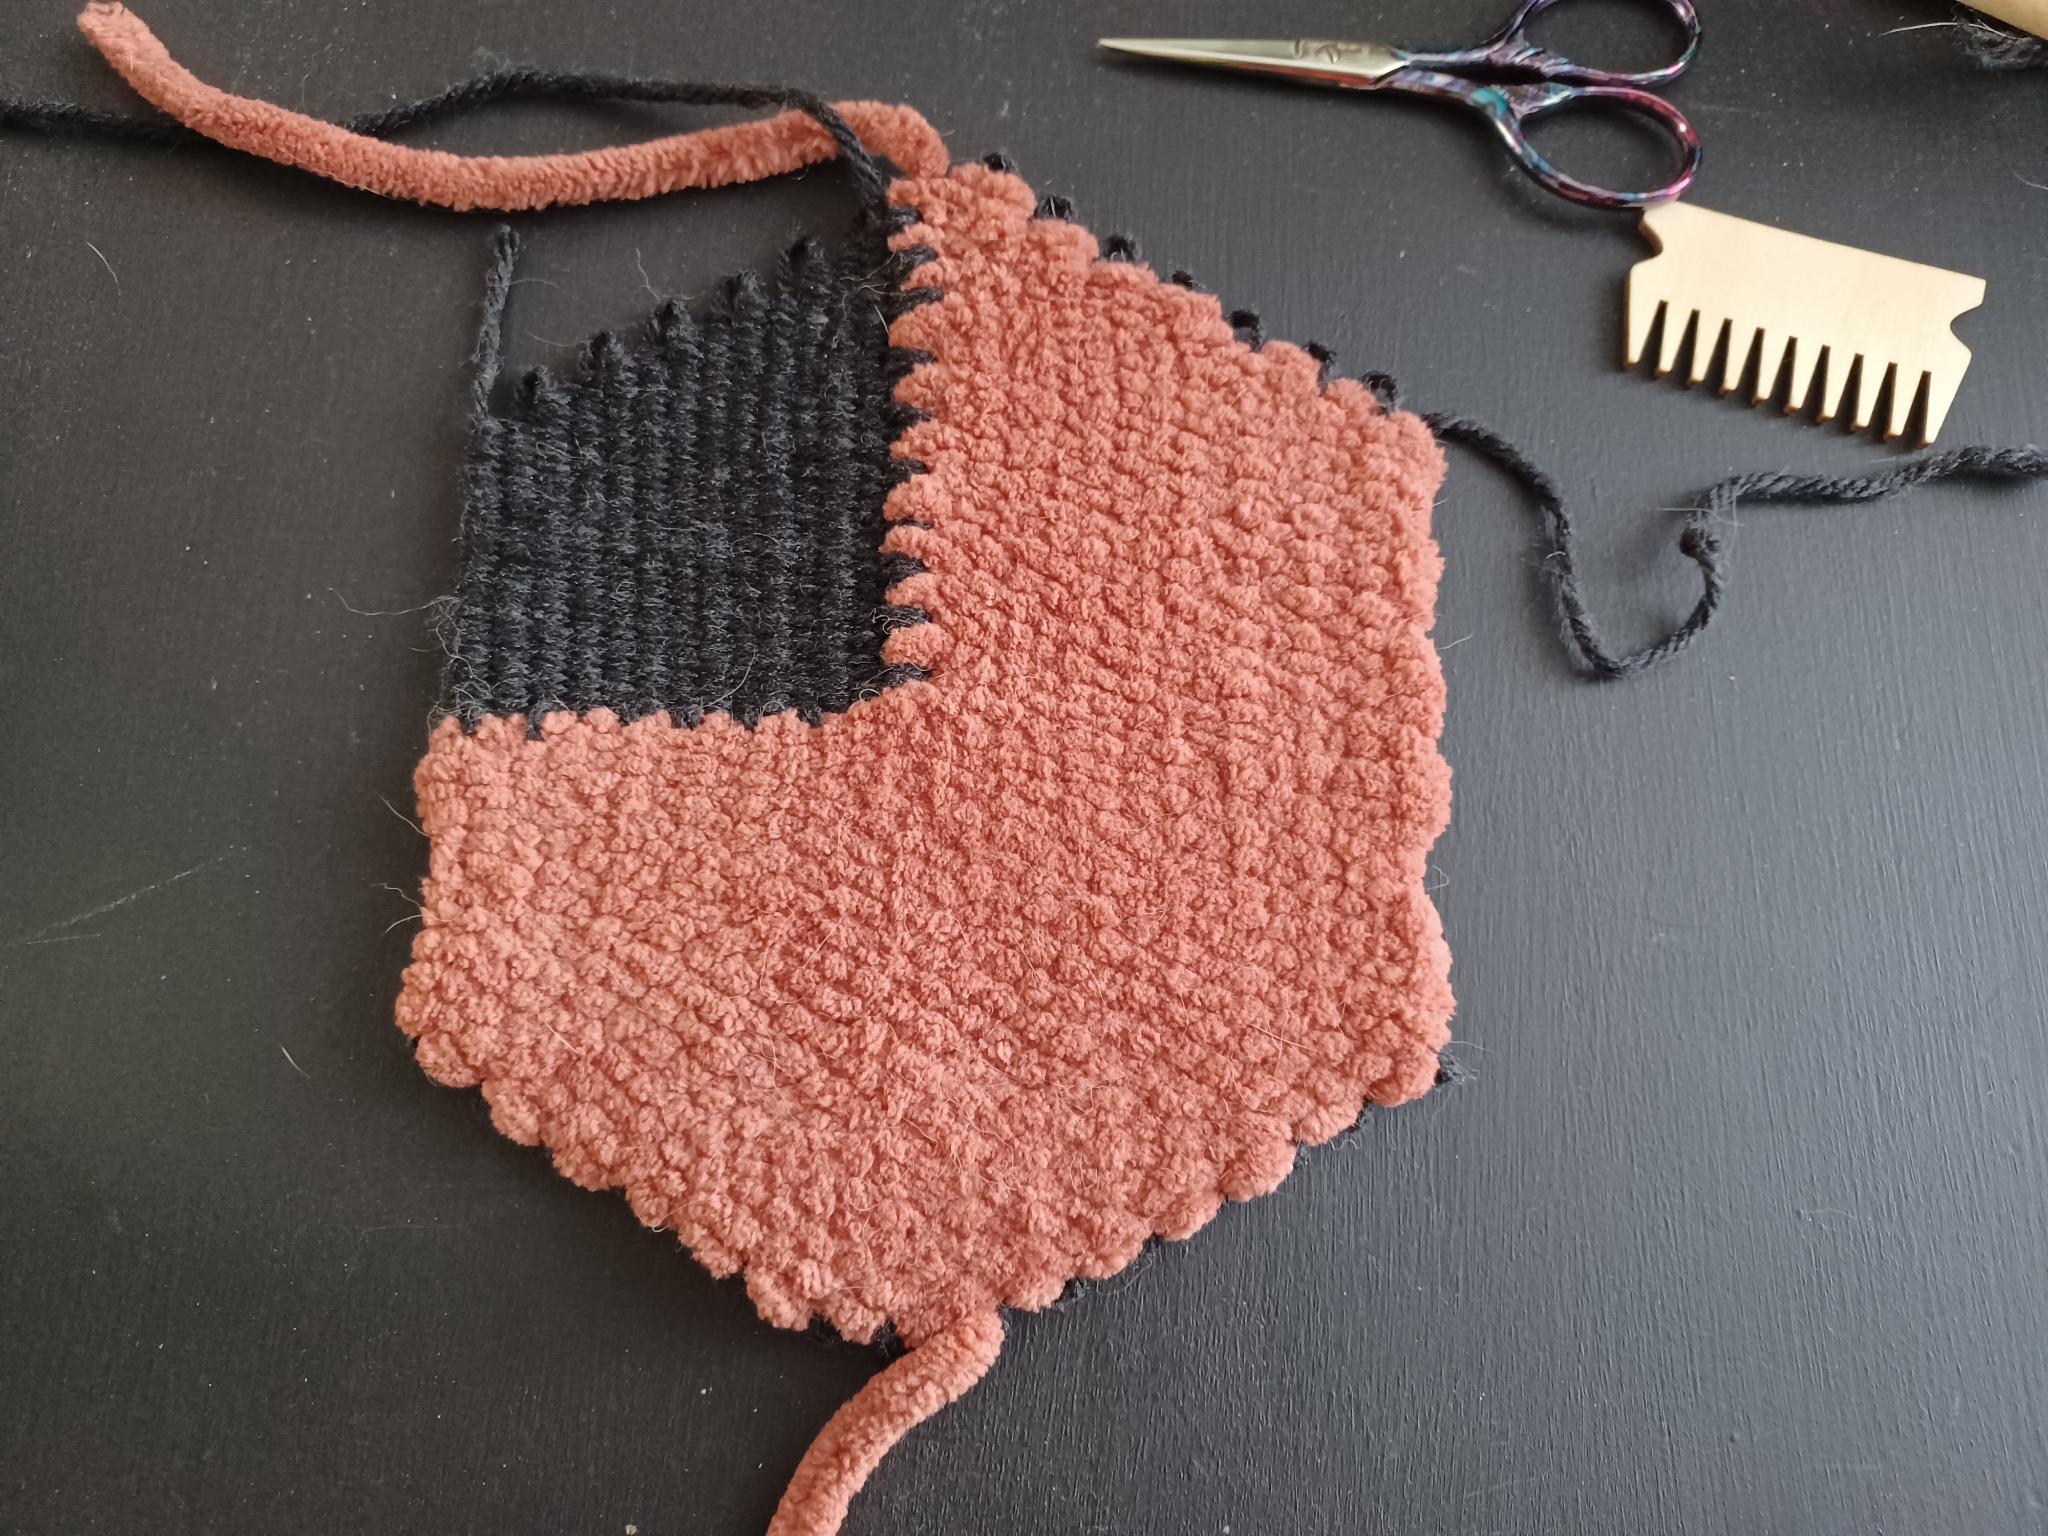
- When you finish the 6-weight section, leave yourself a tail to sew in. Figure 10 shows the completed 77% portion of the work.
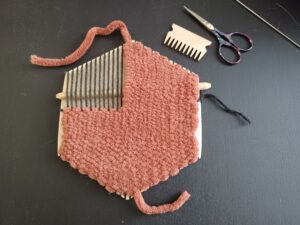
Figure 10: The 77% section of the weave with 6-weight yarn is complete.
- Now thread your needle with the 4-weight yarn again to weave the “negative” data portion.
- Start your weave at the inner corner to meet the 6-weight yarn. Put your first stitch into the 6-weight yarn to connect the sections, as Figure 11 shows. Weave towards the outside using the same above/below pattern.
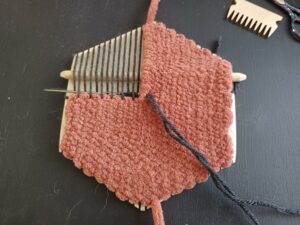
Figure 11: Begin your 4-weight section by weaving into the 6-weight section to connect them.
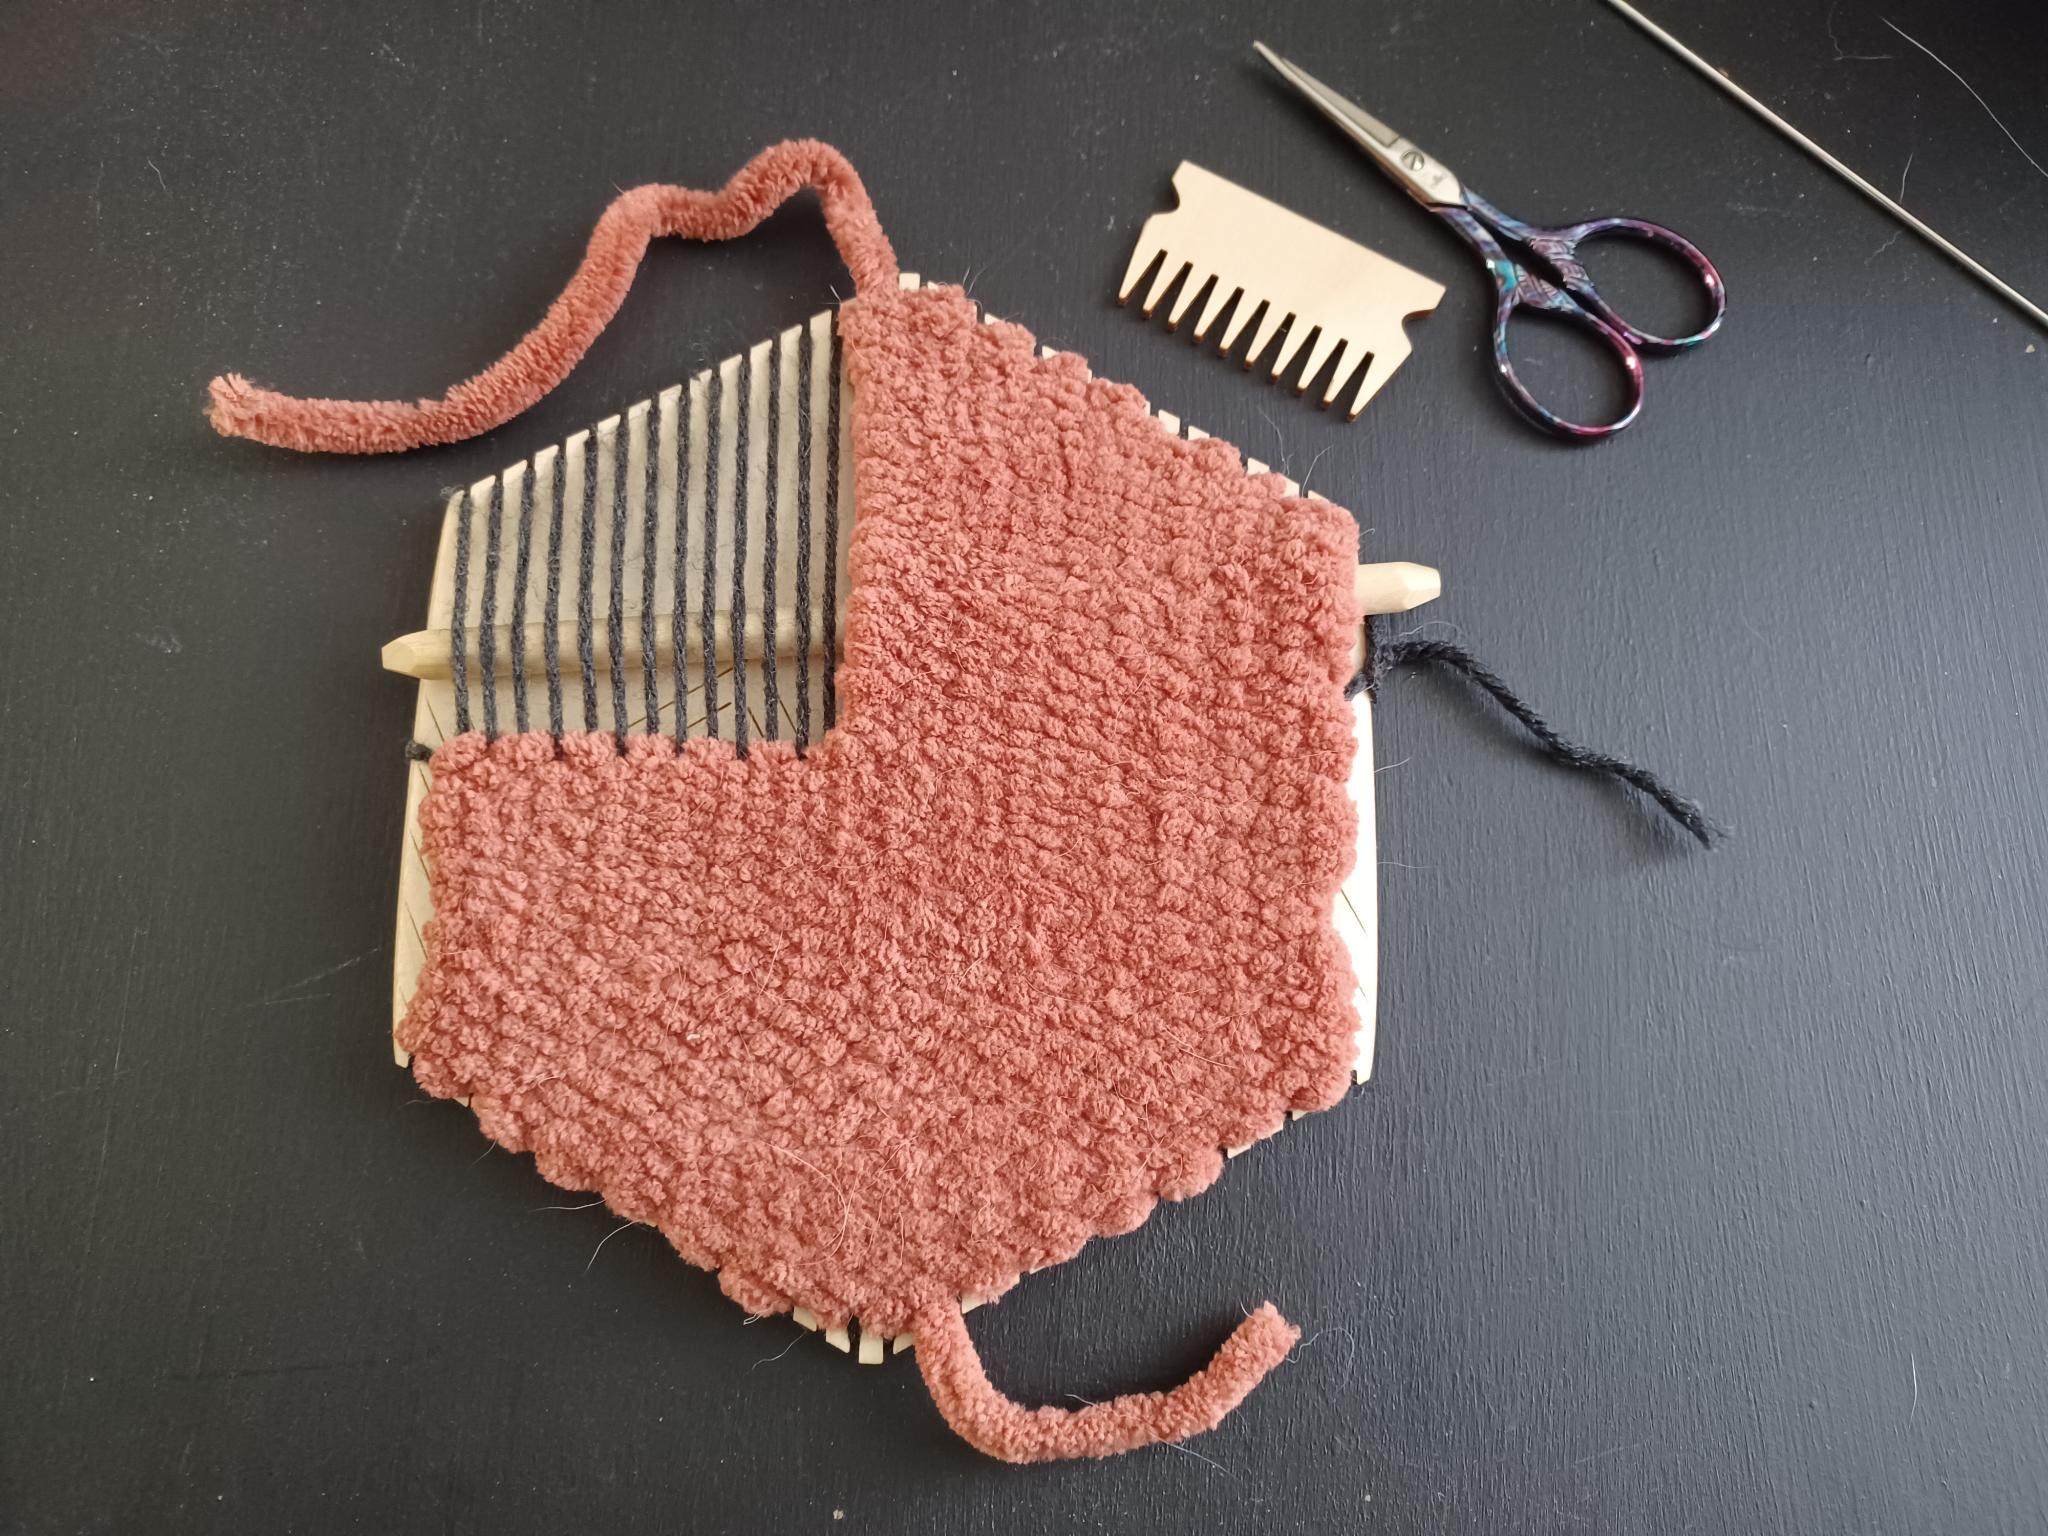
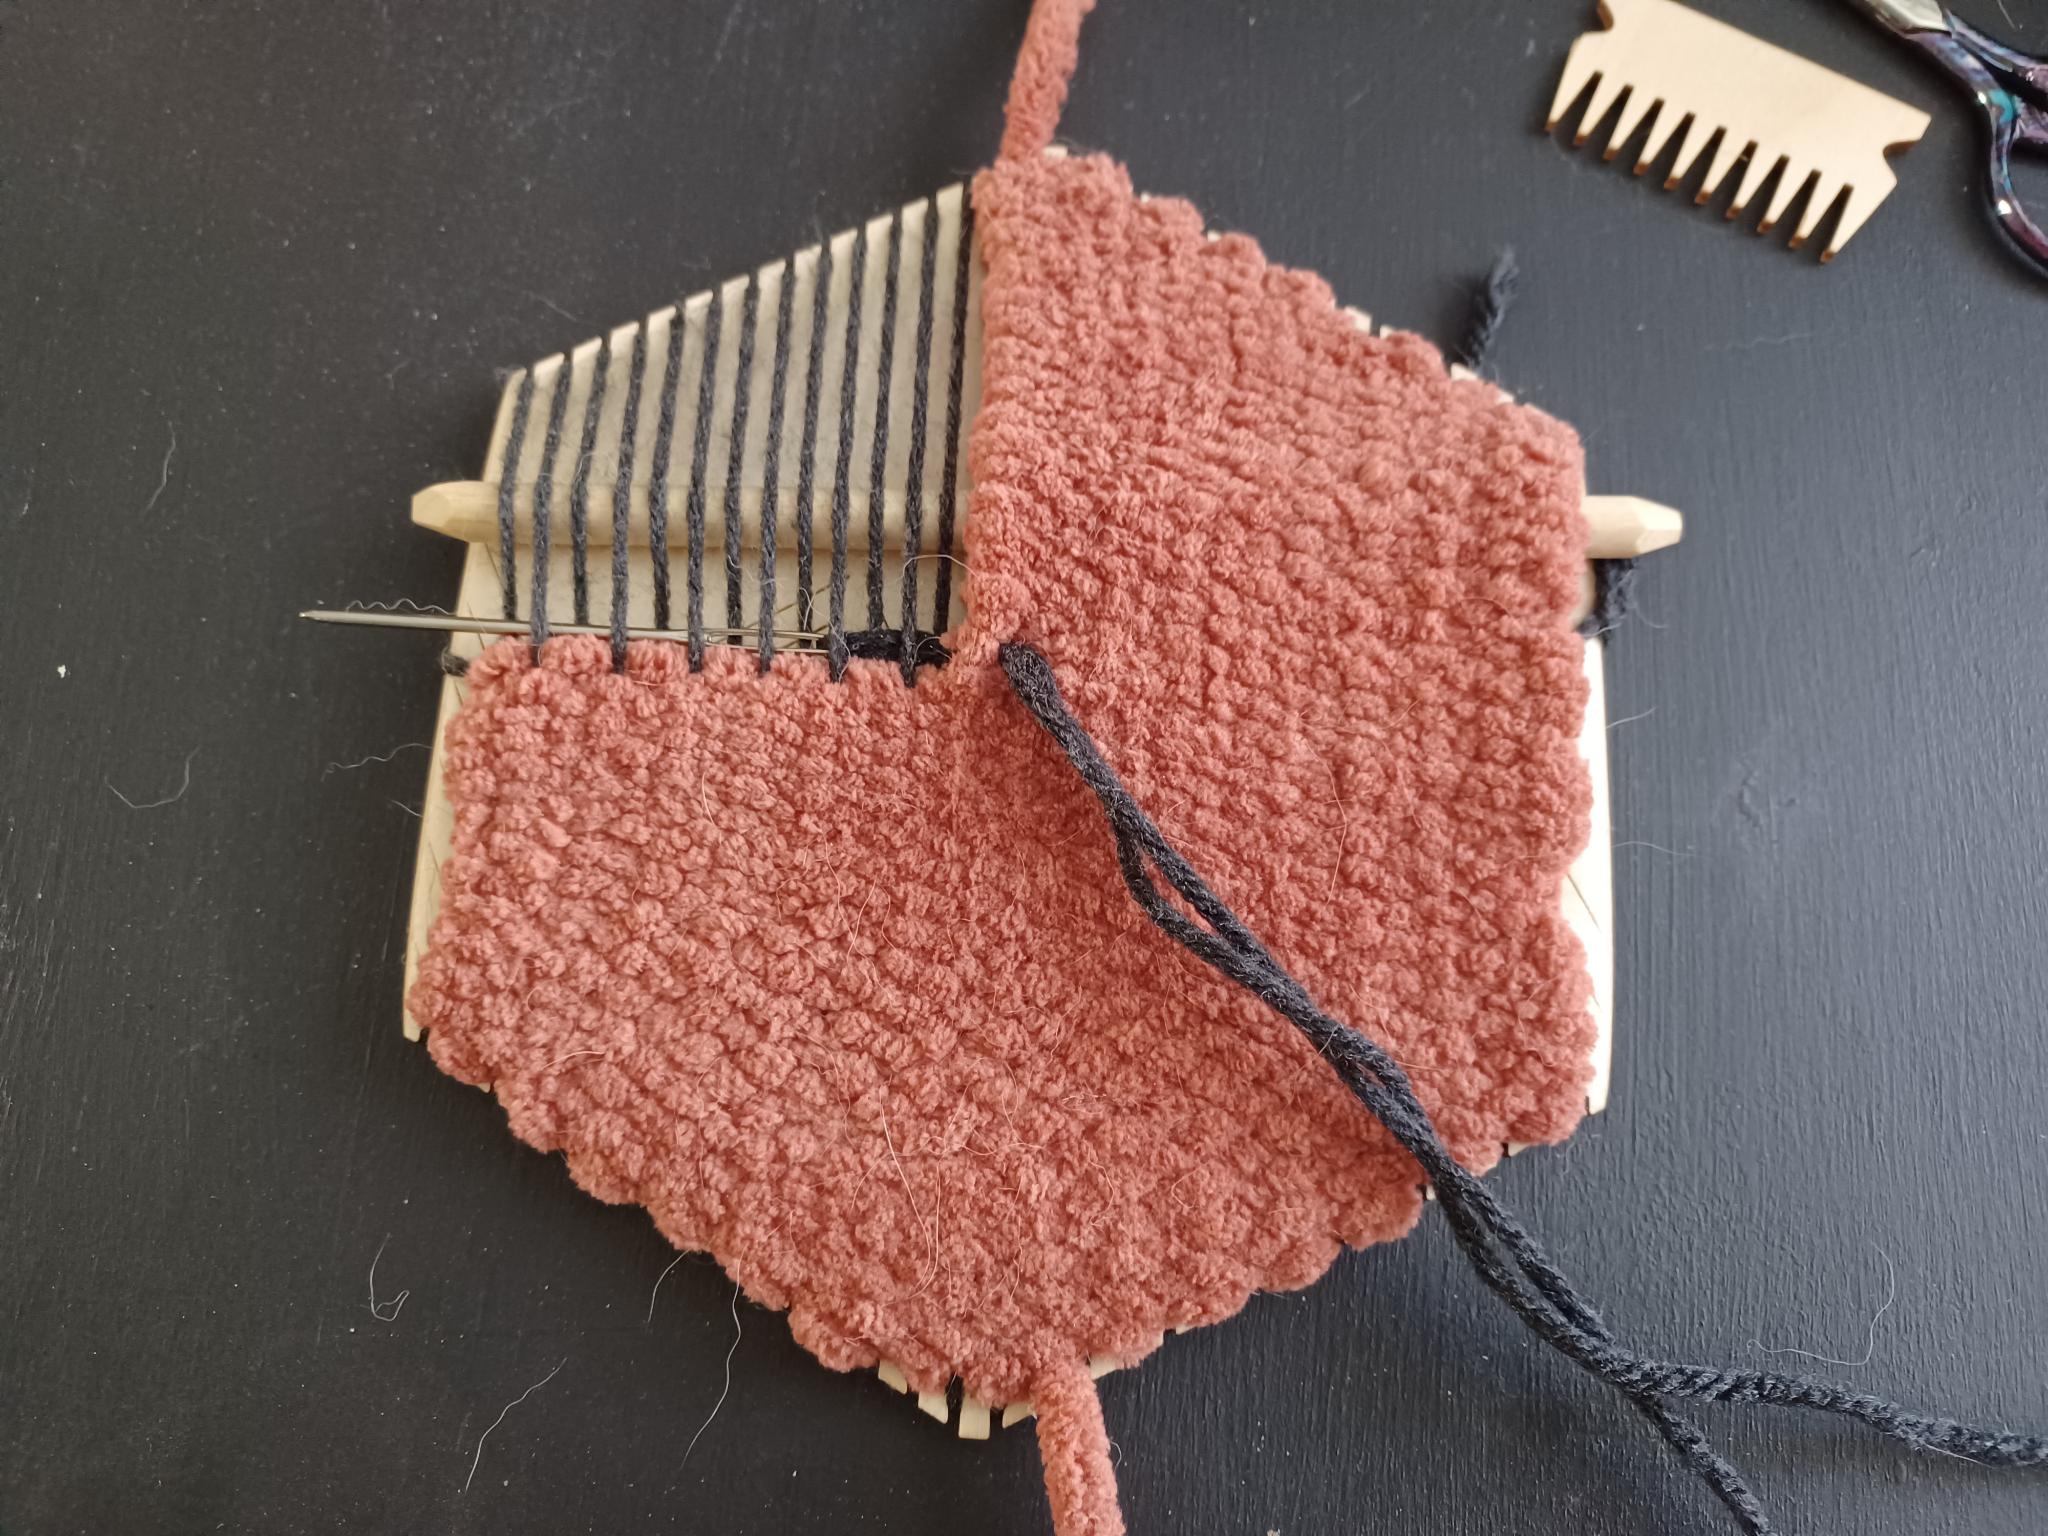
- For your second layer, stitch the 4-weight into the 6-weight as you work towards the centre of the loom. Weave your needle above and below the first two strands, then stitch below into the 6-weight yarn. Then weave above and below the next two strands, then stitch into the 6-weight again. Repeat until you finish this layer.
- Work your third layer back to the outside of the loom as normal. Then follow the pattern of weaving above and below as normal up the remaining section of the loom. Approximately every second or third layer towards the centre of the loom should stitch into the 6-weight yarn to keep it connected. If you do not stitch into the 6-weight yarn like this, the result will be disconnected and not as strong. Figure X shows approximately half of the 4-weight section completed with stitching into the 6-weight section.
- When you finish the rest of the 4-weight section, cut off your remaining yarn and leave a tail long enough to sew in. You can now remove the project from the loom. Carefully remove the warp from the notches around the bottom of the loom, and then the project should easily pop off of the top. Untie or snip the warp that is tied to the loom. You can then sew in all of your ends.
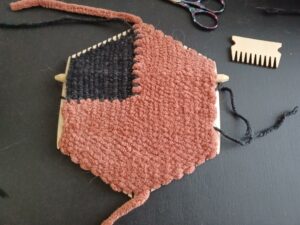
Figure 12: The completed project on the loom.
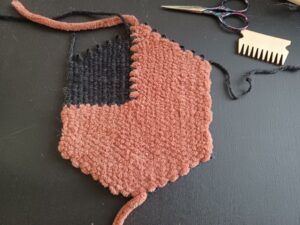
Figure 13: The completed project off the loom.
- You now have a tactile pie chart! Using different weights of yarn allows you to feel the different sections on the chart, and using different colours allows you to quickly see them as well. The next steps are optional, if you want to add braille data labels to your work.
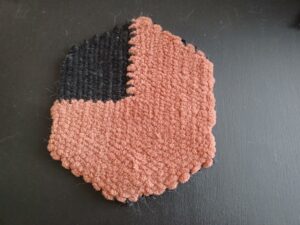
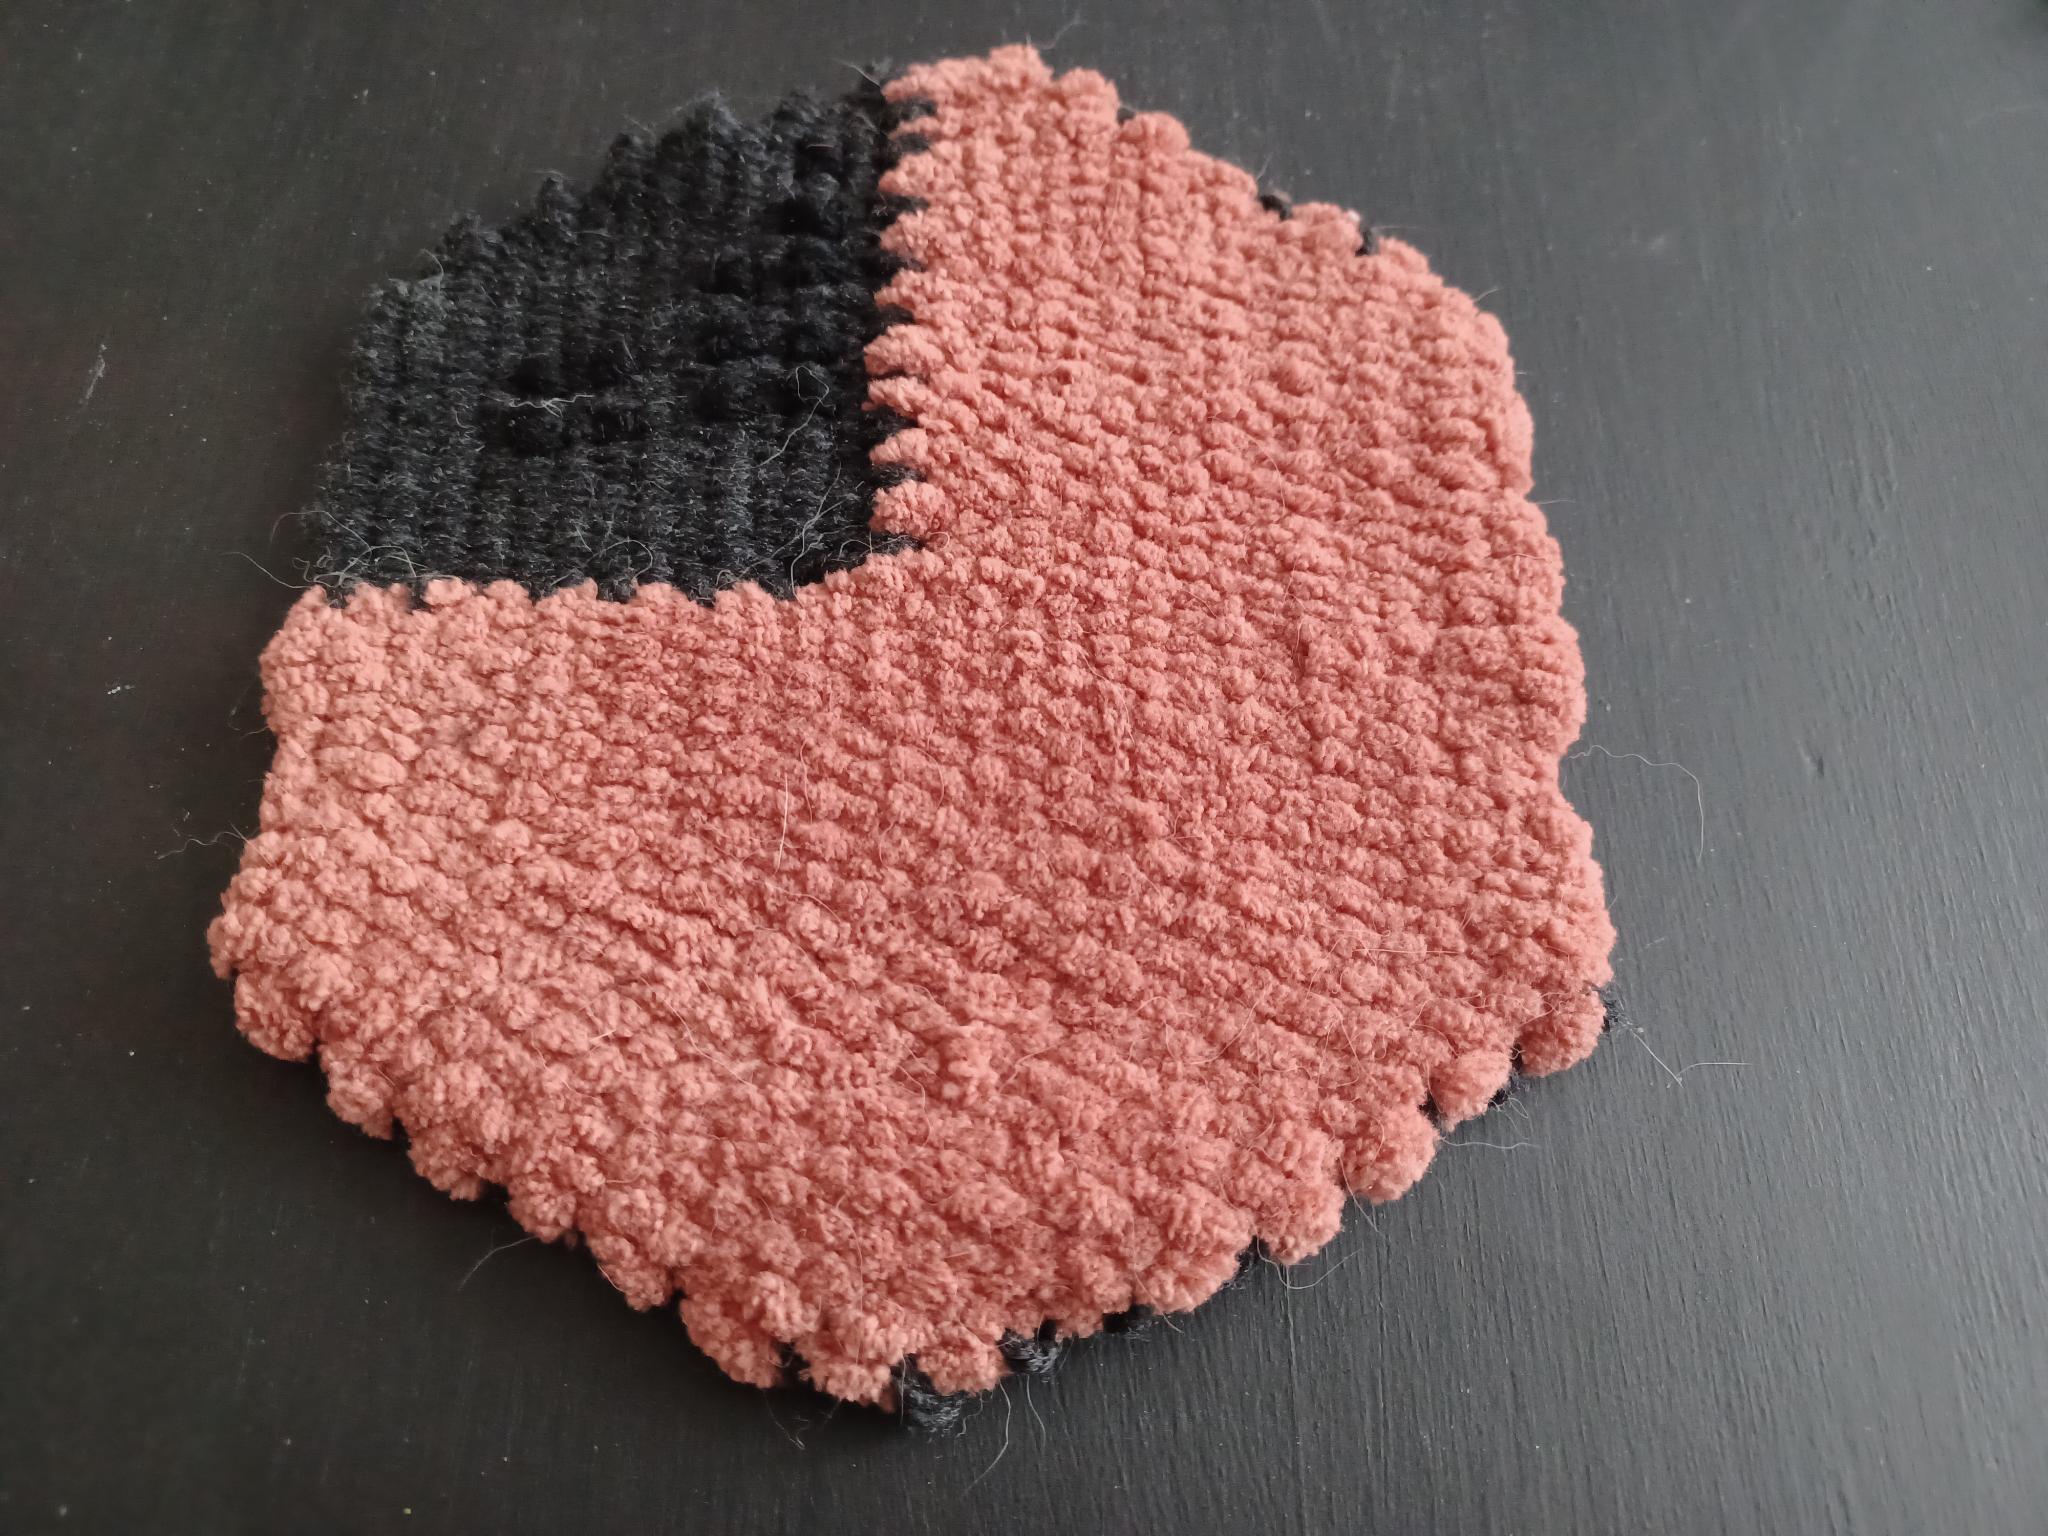
Figure 14: The completed project with the ends sewn in.


Adding braille labels
- See Figure 1 for a guide on braille characters.
- Plan where the braille characters need to be stitched to align properly when finished. If desired, you can use stitch markers to mark where the characters should be to avoid error.
- Thread the 4-weight yarn on your needle to cross-stitch the braille characters. I used the same colour since it is meant to be read tactilely, but you can use a different colour if you want to.
- Braille characters are made up of dots, so each dot in a braille character should be one stitch, and the collection of stitches in a particular pattern creates the braille character. If you are proficient in embroidery, you can use the French knot stitch to create each dot in the braille character. However, I found that my weave was not tight enough to hold the French knot stitch in place, so I did a modified cross-stitch instead. To do the cross-stitch, stitch two lines to make the x and then go over the first line again, so you stitch: \ then / then \ again. The third stitch makes it thicker and easier to read tactilely. For the sample weave, I stitched “77” (⠼⠛⠛—a numerical indicator then “gg” for “77”). There was not enough space to stitch the two-character % sign (⠨⠴), which I would include on labels where I have more space.
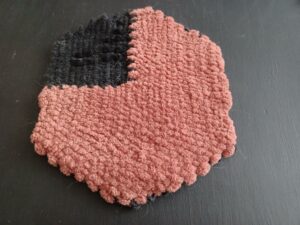
Figure 15: The completed weave with the braille label cross-stitched on.
- To create the paper labels, I used cardstock-thick paper in business card size. This is specifically braille paper, but any form of cardstock should work. I wrote the data label with a pen: 77.4% have difficulty seeing words in print. I then used a braille slate and stylus to write the same label in braille. I chose to use uncontracted braille to make it legible to a larger number of braille readers (explanation in the introduction). Remember to write with your pen before brailling, because it will be difficult to write over the embossed braille. Also note that you need to braille with the stylus backwards and on the backside of the paper so that it embosses to be read on the front, the same side as the writing.
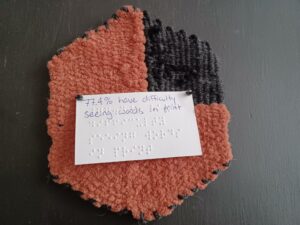
Figure 16: The paper label on the back of the completed weave.
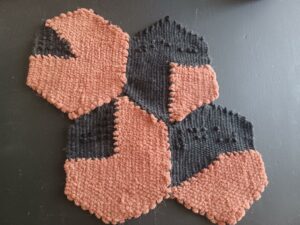
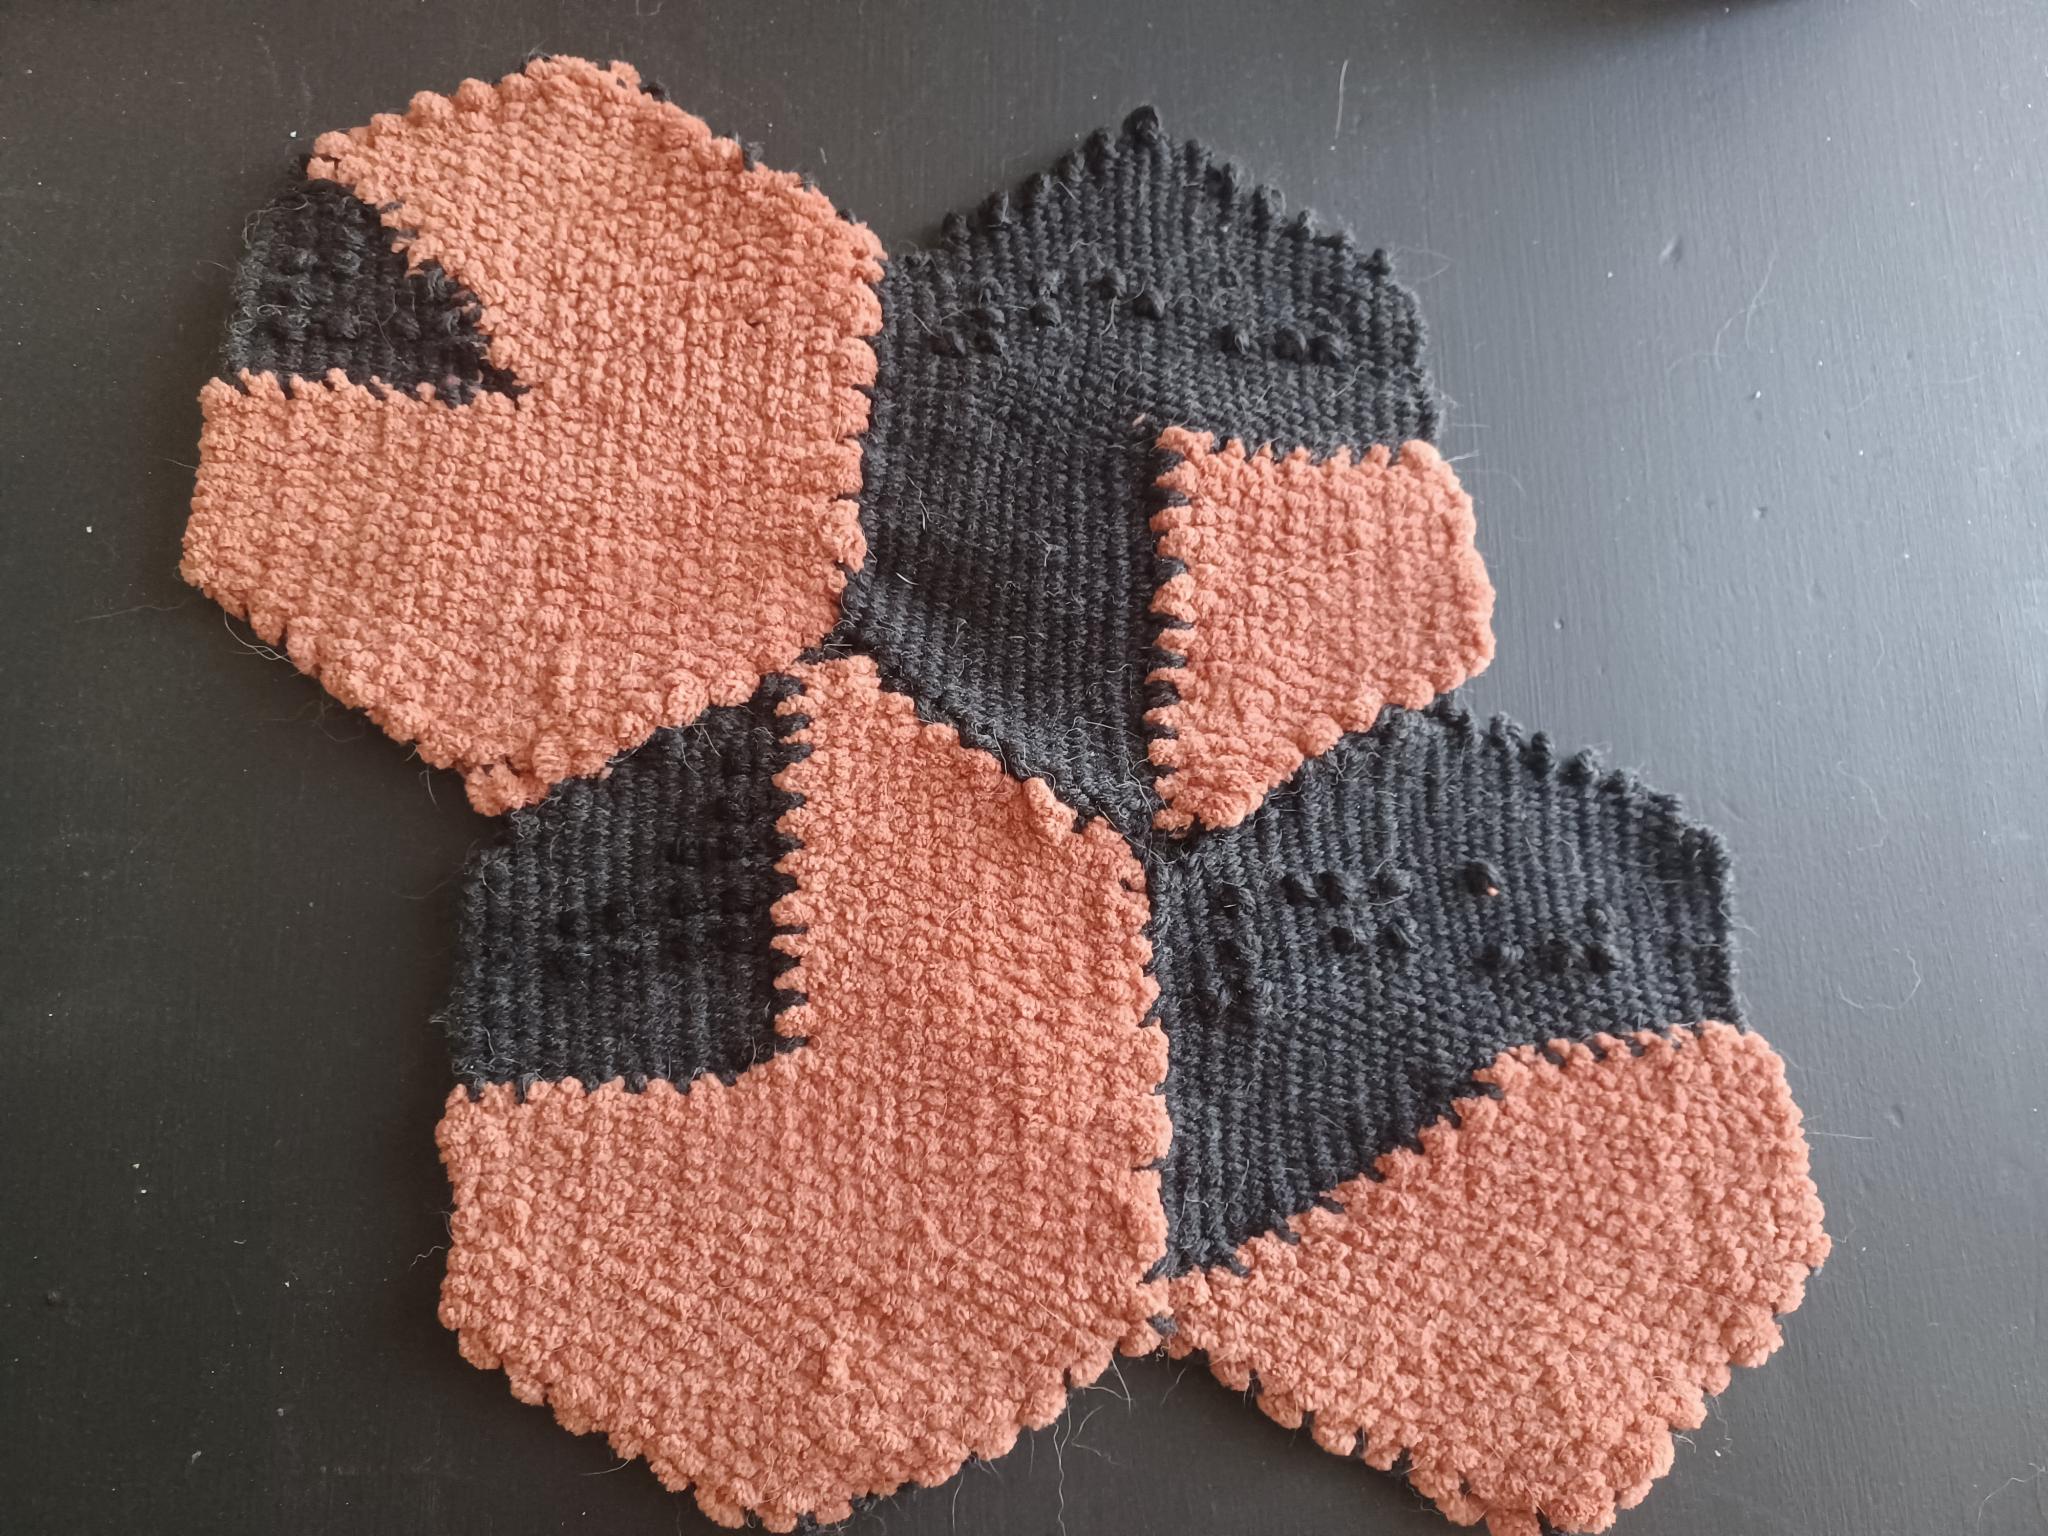
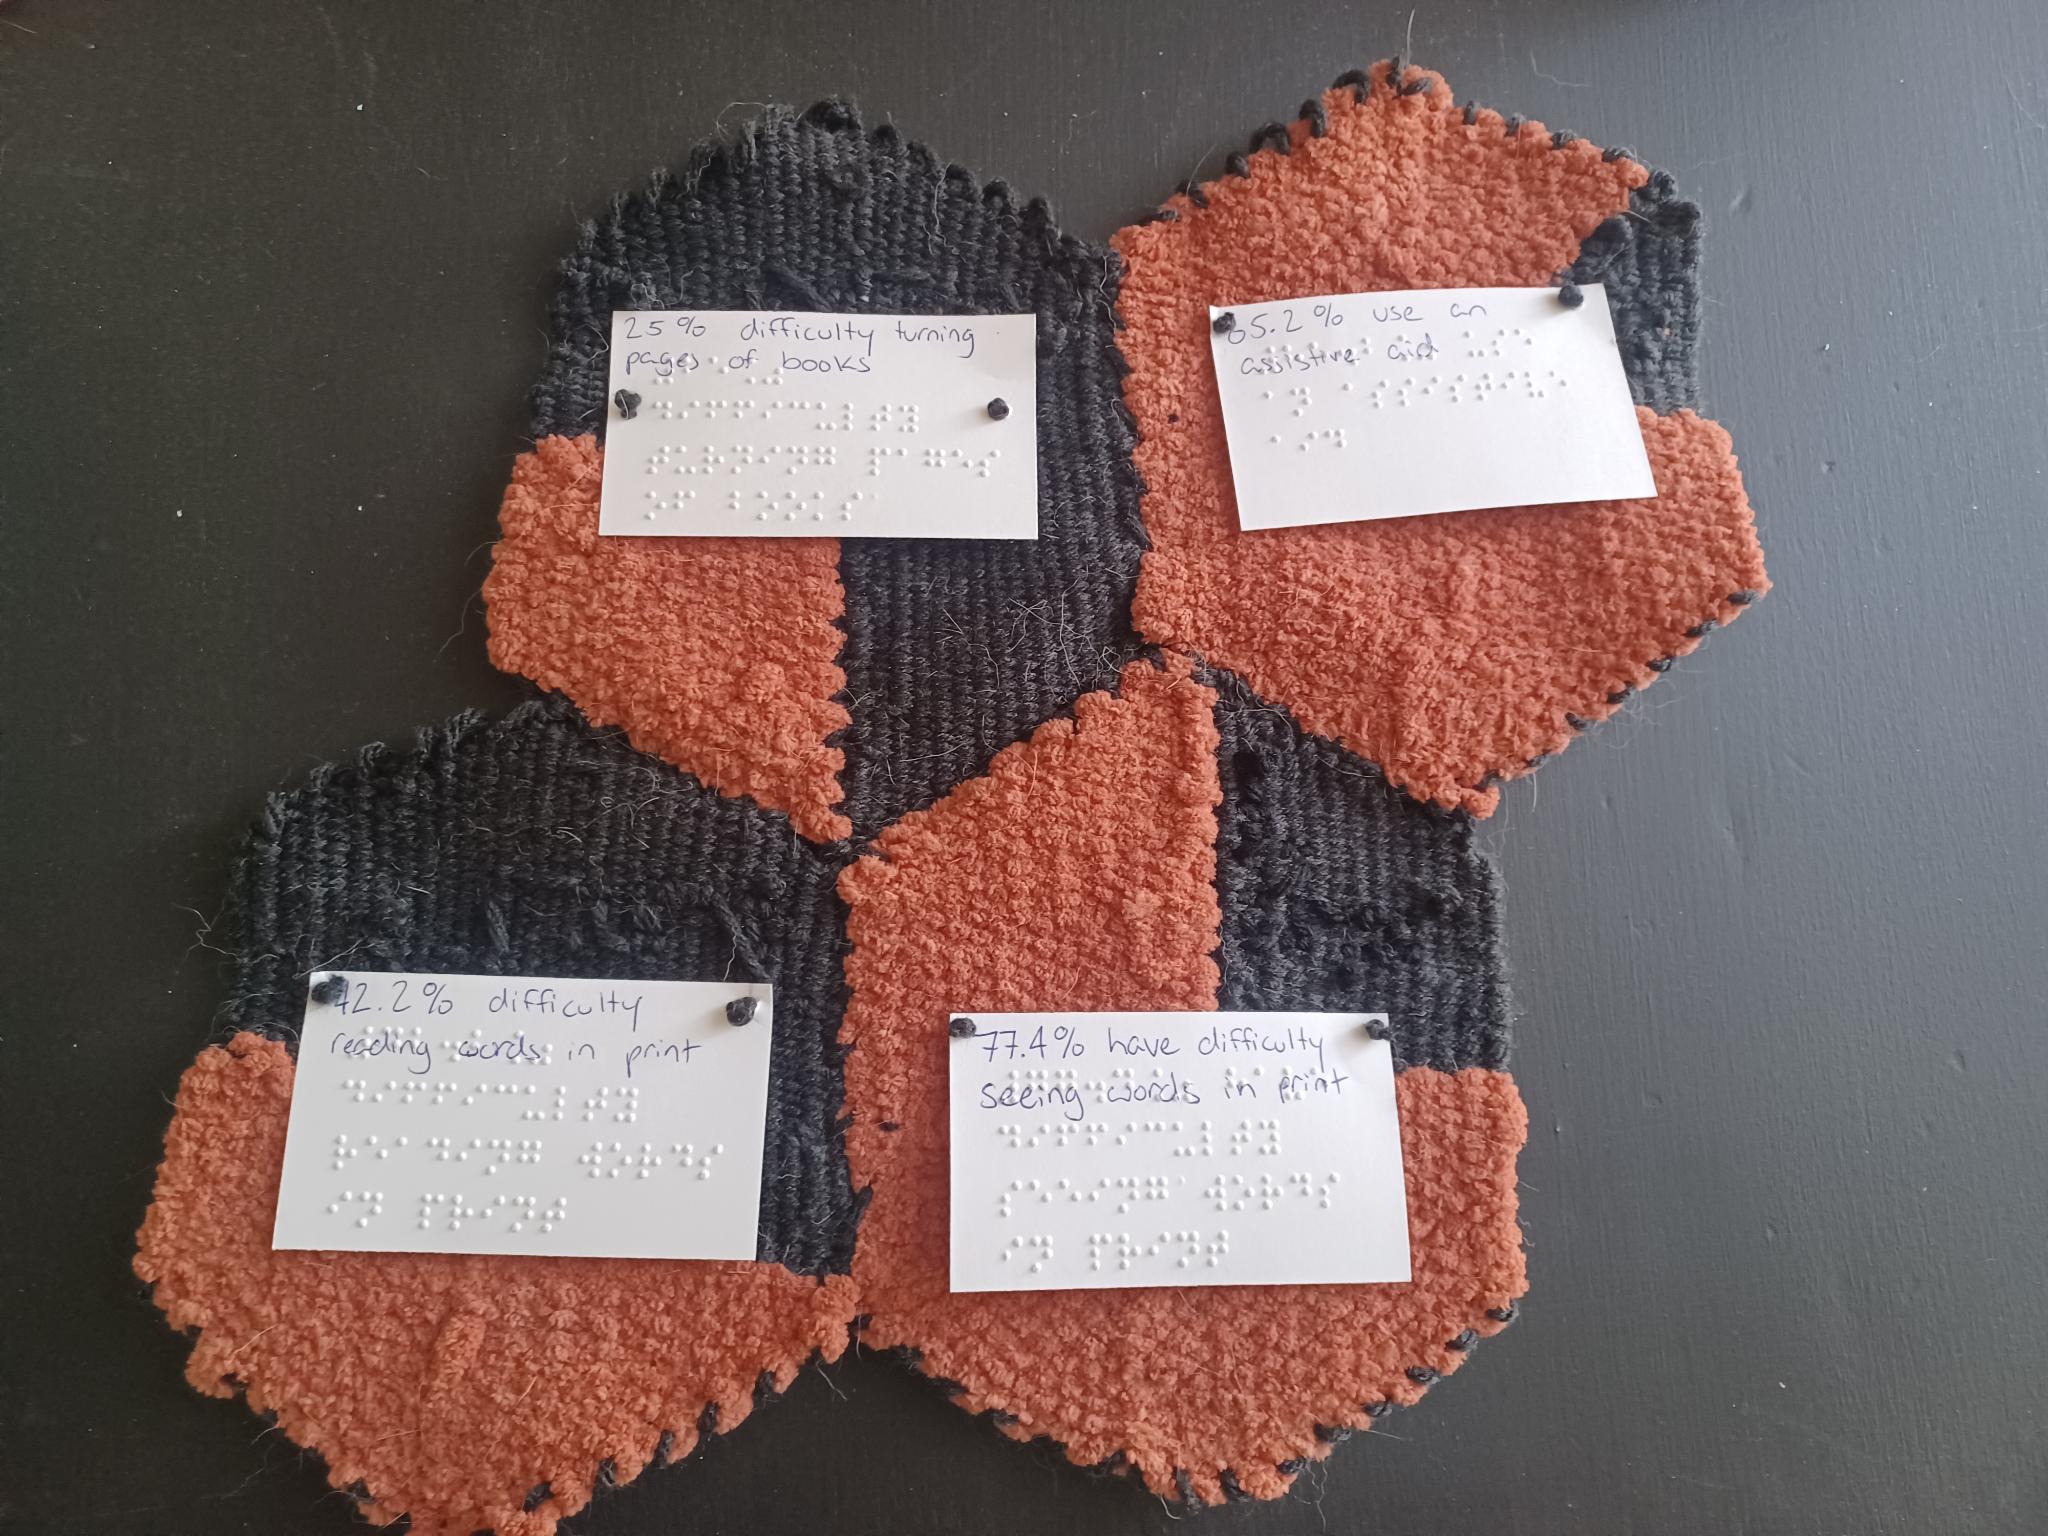
Figure 17: Multiple completed pie charts sewn together to create a tapestry of data.
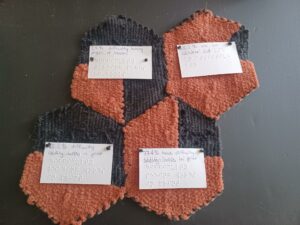
Figure 18: The back view of multiple completed pie charts sewn together to create a tapestry of data.

Ellen Forget
Ellen Forget is a PhD candidate at University of Toronto in the Faculty of Information and the Book History and Print Culture specialization. They are a graduate of the Master of Publishing and Editing Certificate programs at Simon Fraser University, and they are certified in braille transcription from the Canadian National Institute for the Blind.