The following recipe focuses on using data visceralization to engage very difficult data, with an emphasis on what feeling the data can do (as opposed to seeing it), and strategies for contextualizing the data and its effects.
There is a particular subset of visualization-based data science known as Quantified Self. The Quantified Self (QS) movement relies heavily on wearable technologies, specifically wearables that produce data out of the workings of our bodies. Under the guise of promoting health, information harvested from individuals’ bodies undergoes analysis, visualization, and organization based on factors like time, location, and correlation. Through the integration of tracking devices near bodies, the Quantified Self (QS) movement presupposes the impartiality of data sourced from fitness trackers, treating them as mere extensions of the Western philosophical imperative to “know thyself.”
The logic underlying the Quantified Self movement that emerged alongside contemporary fitness trackers is that more data is needed for a better self. This logic is demonstrated in the following visuals. Figure 1 shows a cartoon straight-sized man with a slight paunch surrounded by myriad data points, including weight lifted, emails sent, meals consumed and what seems to be either sperm count or number of sexual partners; the latter data point is unclear. The image is labeled “personal identification numbers,” suggesting that like one’s bank PIN, these numbers reveal something that is typically kept tightly protected. Figure 2 is a screenshot from a New Scientist video about the QS movement, showing a cartoon white man, whom the devil is trying to tempt with donuts. Rather than being opposed by an angel, the devil is instead countered by the quantified self, visualized here as a pink heart with a blank effigy in the middle, surrounded by streaming data. The narrative of this feedback loop between data and self (i.e., the Quantified Self) creates a myopic focus on self-determination and supports fantasies of meritocracy. If one can just understand one’s data, and act upon that understanding, one can improve oneself. If one cannot, it is a failure of inadequate data, poor understanding, or a lack of will, but never of the model of neoliberal self-determination that values efficiency and data over experience, context, and messiness.
-
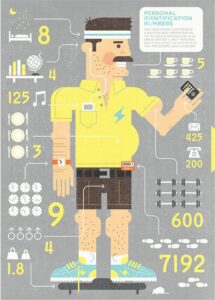
- Figure 1. Understanding The Quantified Self https://www.kalw.org/show/state-bay/2012-11-27/understanding-the-quantified-self
-
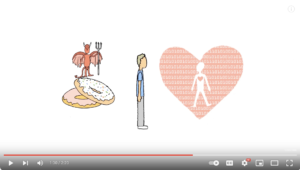
- Figure 2. Screenshot from New Scientist video “The Quantified Self” https://www.youtube.com/watch?v=8wqC6ad1V_Q
If the ideology of the Quantified Self movement privileges the self-optimizing individual primed for productive work, then an alternative conception of wearables for feminist futures requires what I call the Quantified Self-in-kinship (Knight 2018). The Quantified Self-in-kinship refuses neoliberal self-optimization logics, widening the scene to account for the self as an always already-social self.
To further illuminate my concept of the Quantified Self-in-kinship, I’ll focus my recipe on Black Ribbon for Mourning, a critical making project that comes out of Fashioning Circuits, a public humanities research collective that I co-founded in 2011 and for which I am the ongoing director. Critical making is one of Fashioning Circuits’ central methods of engaging questions and disseminating knowledge. Scholars define critical making as critical thinking meets making, or interpreting with and through technology. In Fashioning Circuits, I describe it as drawing on the expressive potential of the technology we study, using and misusing it to collaborate and engage communities.
Black Ribbon for Mourning centers on 2016 police killings of Black persons in the U.S. Black Ribbon for Mourning was created in 2017 with my collaborator Jessica C. Murphy for the HASTAC exhibition on the Wearable and Tangible Possible Worlds of Digital Humanities, an exhibition that I co-curated with Jacqueline Wernimont that collectively suggested that one of the possible worlds of DH is material, embodied, and grounded in feminist approaches. Many of our UT Dallas students and faculty colleagues offered stitching support for the project and the project draws upon data from MappingPoliceViolence.org, whose project leaders are Samuel Sinyangwe, Deray McKesson, and Brittney Packnett Cunningham.
Black Ribbon for Mourning starts with a number: 309. According to MappingPoliceViolence.org, there were 309 Black people killed by the police in 2016. While Black Americans made up only 13% of the U.S. population that year, they accounted for 26.7% of people killed by the police. Black Ribbon for Mourning draws connections between the contemporary epidemic of police killings that grows out of anti-Black racism, and the logics and economy of colonialism and the 17th century slave trade. We take our title from Robert Ligon’s 1657 book A True and Exact History of the Island of Barbados, a colonial operating manual of sorts for Caribbean plantation owners that Molly Farrell (2016) identifies as an early instance of “human accounting.”
Farrell suggests that Ligon’s clothing budget for the sugar plantation articulates social hierarchies and is performative in the way that it conflates people and commodities. In a striking passage, Ligon writes, “Black Ribbon for mourning, is much worn there, by reason their mortality is greater, and therefore upon that commodity I would bestow twenty pound” (qtd. in Farrell 2016, 95). The inconvenient and expensive mortality here is that of the enslaved person, whose death necessitates the purchase of black ribbon so that kin may signal that they are in mourning. Ligon’s casual enumeration of the hidden costs of the 17th century mortality of enslaved persons and the attendant costs of mourning rituals reminds us that data points and their articulation often suppress the complexity of lived realities.
The two instances, 2016 police killings and Ligon’s 1657 book, are separated by 359 years but connected in many ways, including that they share a logic of misplaced solutionism. For Ligon, the response to the mortality of enslaved persons is not to abolish the conditions of slavery, nor the colonialism which depends on its violence, but to budget more money for the signifiers of mourning. In contemporary policing, solutions are often sought in militarization or surveillance technology, rather than examining the flaws in the fundamental principles of policing itself.
Black Ribbon for Mourning involves a square frame mounted on a wall (figure 3). Twenty black ribbons, in reference to Ligon’s twenty pound, are woven together. As participants approach the square, they are invited to remove a ribbon and tie it around their arm (figure 4). The ribbons have a LilyPad Arduino and a vibrating motor sewn into them and are programmed to pulse, with each one-second vibration representing a black person killed by police in 2016. A longer vibration indicates multiple people killed in one incident, while multiple short pulses signify separate incidents on the same day.
-
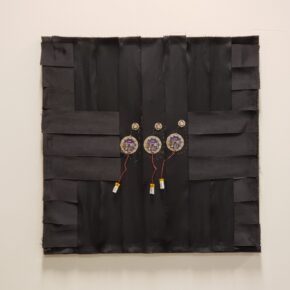
- Figure 3. Black Ribbon for Mourning, mounted for exhibition. Photo by Philip Martin.
-
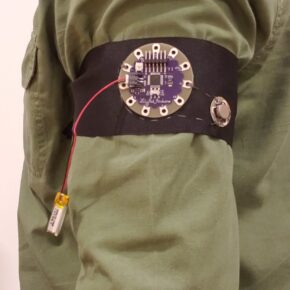
- Figure 4. One black ribbon worn on the upper arm. Photo by Philip Martin.
Originally conceived of for a half-day exhibition, the entire “year” of 2016 passes in four hours, with each day lasting 39.3 seconds. Carrying the ribbon with them, the wearer experiences a faint vibration, timed at intervals that do not, cannot, make sense. As ribbons are removed from the tapestry, the first names of those killed become visible (figure 5), gesturing towards the possible world where Black lives are named and matter, which can only happen in the absence of black ribbon.
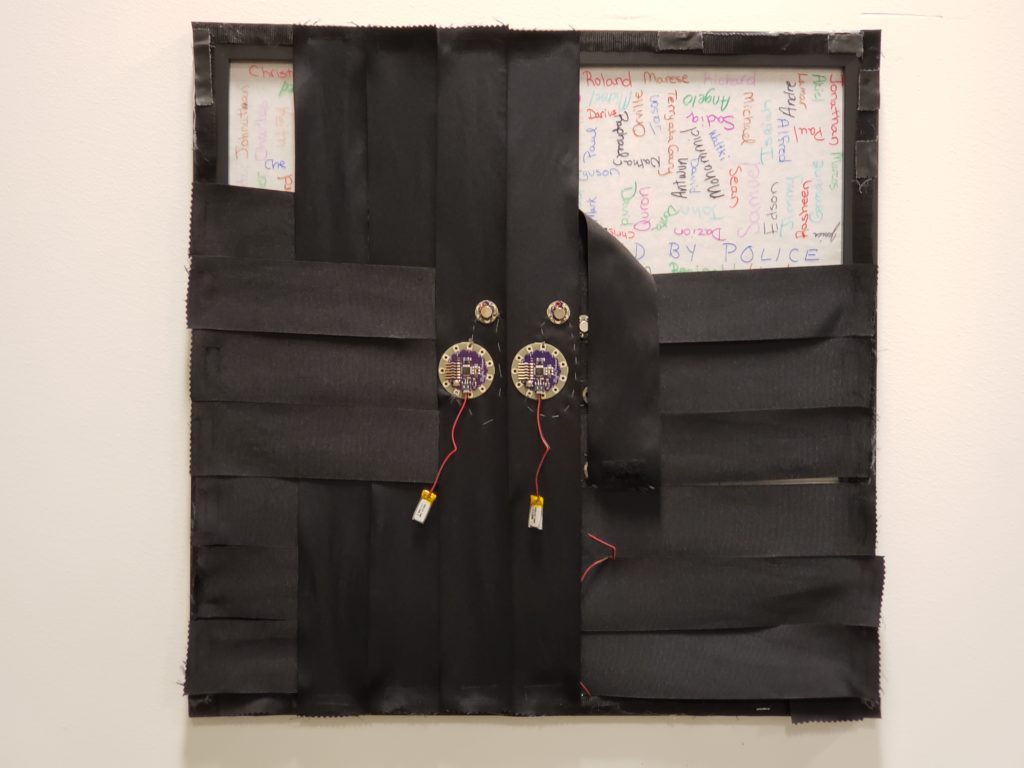
Figure 5. Black Ribbon in the middle of installation, with some names visible. Photo by Philip Martin.
The signifying strategies of Black Ribbon for Mourning extend into the code itself, which is made available on a laptop sitting next to the wall hanging. There was a way to code this that involved a spreadsheet and automating the calculations via Arduino. This would have been efficient; seamless. However, the coding, for me, was a ritual of memorialization. As you can see in this screen grab of the code (figure 6), I hand-coded it, line by line, commenting in the name of each person killed. In some cases, I also noted details about the person’s death, such as the January 10th death of Gynnya McMillen who was only 16 years old and died as a result of restraint when taken into custody at a juvenile detention center in Elizabethtown, KY. My collaborator, Jessica C. Murphy, hand wrote each name on the glass as her daughter read them aloud as part of her ritual of memorializing. In both cases, this was our attempt to recognize the lives behind the data. The handwriting is imperfect. The code is not elegant. In fact, it is somewhat glitchy. But how could it not be? The texture of the data lives in the acts of naming and in allowing the imperfections to stand as we repudiate the imperative to efficiency.
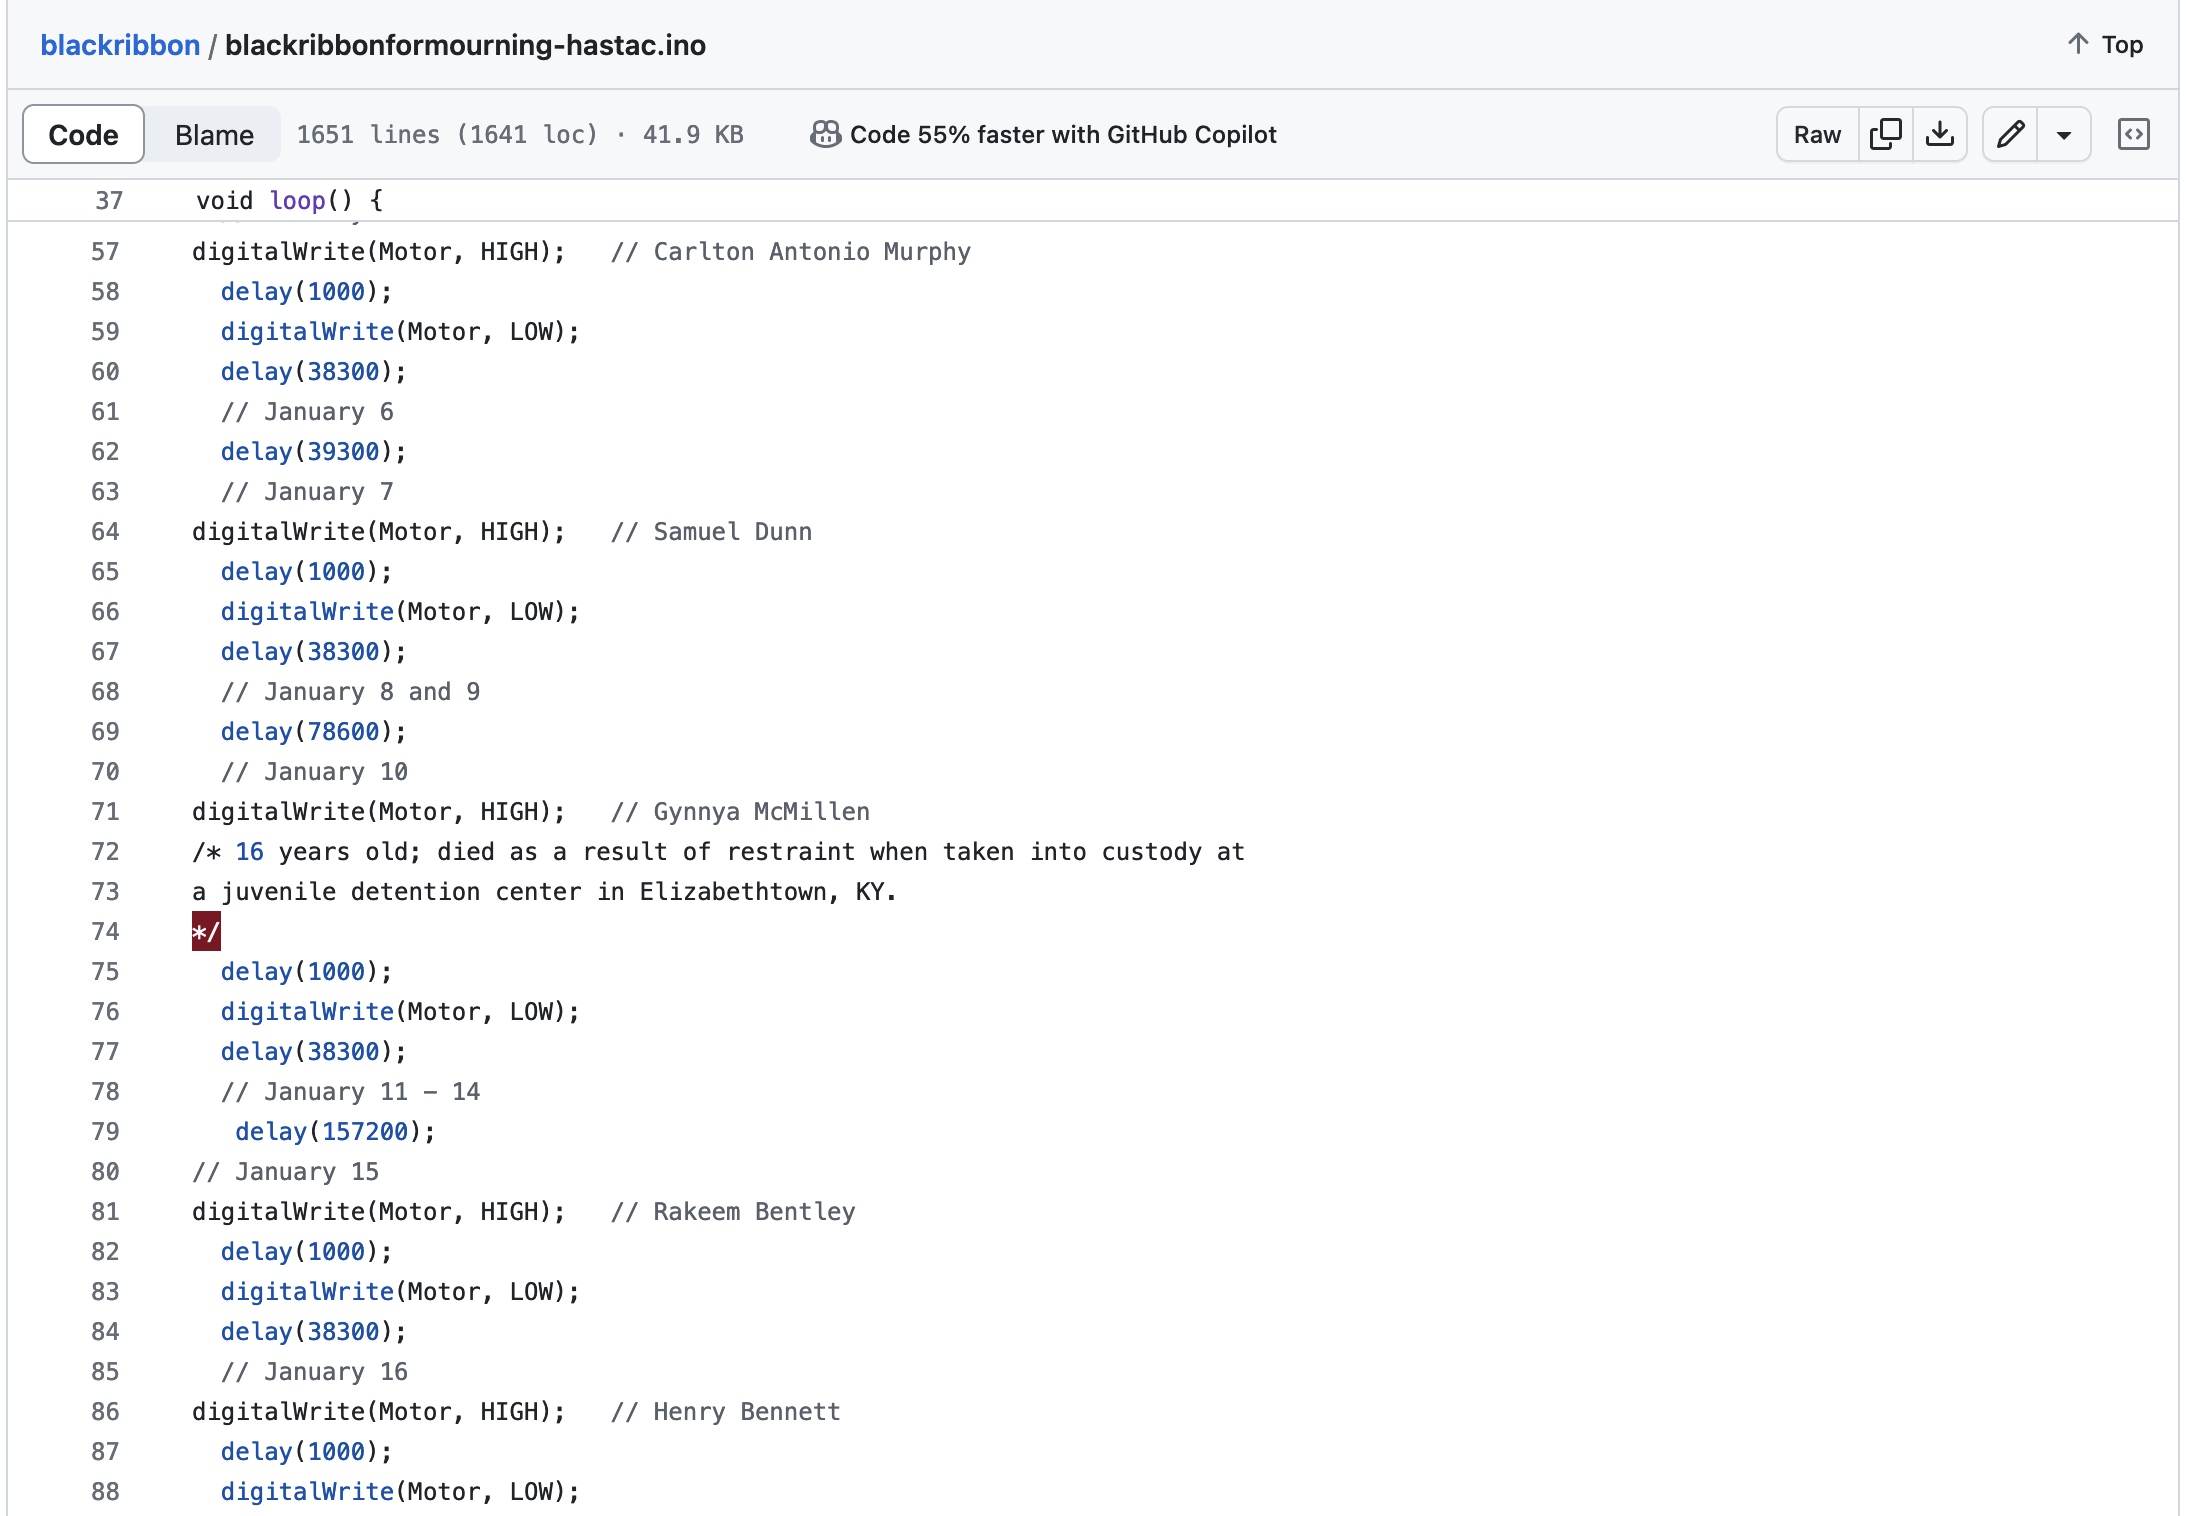
Figure 6. Arduino code for Black Ribbon for Mourning. Available at https://github.com/purplekimchi/blackribbon/tree/master
The project makes two key refusals that challenge the paradigms of data science and technological innovation. First, instead of data visualization, it foregrounds data visceralization – that is, making data felt – as a praxis that thwarts the visual regime that privileges efficient transmission.
By putting on the armband, the user tacitly agrees to allow the archive of names encoded in the ribbon to operate upon them for up to four hours. During this time, they may be browsing other artworks, sitting in panels, and so forth, moving through different spaces and attending to different matters. While the installed frame suggests a site-specific meaning, the armband travels. Thus, the data and the wearer’s experience of it are continually being recontextualized. This rebuffs the data visualization method of arranging data into discernible patterns within a stabilized and fixed frame.
In rejecting data’s visualization, the project attempts a detourning of visuality’s origins in and contemporary presents in anti-Black violence. In “The Right to Look” visual culture scholar Nicholas Mirzoeff identifies visuality as problematically “manifest[ing] the authority of the visualizer” (2011, 474). He traces the origin of visuality back to what he terms the “plantation complex,” the shaping of reality and imagination that originates from the surveillance and visual strategies of the slave trade, the techniques of which are embodied in the figure of the overseer. Mirzoeff (2011) argues that visual complexes are formed in stages, through classifying, separating, and aestheticizing, and he identifies the 1670 requirement to map all plantations as being one classifying strategy that was fundamental to the formation of the plantation complex. Though he does not name it as such, this places information visualization at the birth of the plantation complex. These entanglements persist into contemporary times as noted by Black studies scholars such Brian Jefferson Jordan, who argues that predictive crime mapping legitimates racialized geographies, or Katherine McKittrick who critiques the actuarial algorithms that visualize Black death in an act of prognostication.
Rather than manifesting the authority of the visualizer, the feminist DH approach of Black Ribbon for Mourning circumvents the professional ground rules of data science and asserts the importance of subjects and the role of subjectivity. By interrupting the visual and instead tying data to the material specificities of embodiment, the project refuses what African American Studies scholar Ruha Benjamin notes as the tendency for some technologies to “render Black people hypervisible,” exposing them to social and political vulnerability (2020, 99). I suggest that by thwarting the visuality complex, the project attends to Benjamin’s call for strategic exposure, that which resists intrusive or violent visibility and intentionally exposes selective information in the name of challenging erasures, making structures of oppression perceptible (2020, 127).
The second paradigm-challenging refusal of Black Ribbon for Mourning is that in making data felt while removed from the visual field, the project also refuses to reproduce the spectacle of black suffering, which is historically (and contemporarily) exploited in an attempt to produce empathy.
Critical race scholars have extensively scrutinized the notion of empathy. Saidiya Hartman (2022) highlights that narratives depicting violence often inadvertently perpetuate the violence, exposing the “precariousness of empathy” wherein the role of a witness can easily transition into that of a mere spectator. In the pursuit of eliciting empathetic responses, there’s a danger of overshadowing the experiences of those who have endured suffering, reducing them to objects of our own emotions. Hartman emphatically asks, “Can the white witness of the spectacle of suffering affirm the materiality of black sentience only by feeling for himself?” (2022, 24). Her critique suggests a deficiency in white witnessing that requires contrived empathy.
In examinations of race within digital contexts, Ruha Benjamin (2020) observes a growing prevalence of empathy in the marketing strategies of digital technology. Moreover, Lisa Nakamura (2020), in her work “Feeling Good About Feeling Bad,” highlights the inadequacies in leveraging technologies of immersion and simulation to foster empathy. She critiques recent virtual reality initiatives that aim to immerse viewers in the experiences of marginalized individuals, arguing that they often fail to put the user “in the shoes” of the subject, resulting instead in what she terms “toxic re-embodiment” (2020, 51) – a situation where individuals occupy the bodies of others who may not even have autonomy over their own bodies.
Hartman, Benjamin, and Nakamura’s critiques articulate much of what makes Murphy and I uneasy about empathy and prompts us to try to avoid the problematic trap of generating (White) empathy at the expense of (Black) subjects (and the data around their deaths). There is no way in which Black Ribbon for Mourning could possibly emulate the feeling of being Black in the U.S. for non-Black users, nor is it the goal for it to do so. Nor for Black users can the data presented be interpreted as a stable and complete historical accounting of the violence perpetrated against Black Americans at the hands of the police. Rather than activating toxic re-embodiment to occupy the body of an “othered” person, the project aims to keep the focus on the user and the social systems in which they are immersed.
Nakamura (2020) suggests that the “implied presence” of so-called “virtuous VR” fails to produce knowledge about an-other. In contrast, Black Ribbon’s nebulous pattern of interruptions attempts to unsettle what is known about the user’s world and the systems of violence that are always active alongside our everyday activities. For a thoughtful user, this unsettling can be an embodied challenge to their epistemological framework, creating what feminist scholar Claire Hemmings has identified as an affective shift, the “gap between self-narration and social reality” that might develop into “affective solidarity,” “an account of experience that is dynamic rather than essentializing” (2012, 157). In other words, affective solidarity avoids the most problematic tendencies of empathy as identified by Hartman and other scholars. Black Ribbon for Mourning is elastic in that it engenders a range of effects for different audiences. For some it may act as a tactile reminder of the epidemic of police violence; for others a prompt to reflect on their role in what Patricia Hill Collins (2000) terms the “matrix of domination;” for still others, a step in the process of developing affective solidarity. This is the “quantified self-in-kinship” (Knight 2018). Quantification is used in this case to resist the essentializing outcomes of empathy and provide an affective shift instead.
Creating encounters that facilitate this kind of reflexivity is the motivation for me, as a white woman, to do the work of data visceralization. Black Ribbon for Mourning is meant to raise and suspend questions – drawing on Sara Hendren’s work on disability and DH – for an audience who may not yet be at that moment of reflexivity.
Recipe for Feeling Data and Affective Solidarity
Ingredients
Items 5-10 can be found on this shopping list from Sparkfun electronics.
- A data set that tracks one data point over a period of time, plus any important contextual information about the data.
- A length of black ribbon or any other kind of textile that can be worn close to the body.
- Arduino IDE software.
- Fabric glue.
- A LilyPad Arduino microcontroller.
- A LilyPad vibrating motor.
- A spool of stainless steel conductive thread.
- A 3.7v rechargeable Lithium-Ion battery with a JST connector.
- USB cable to connect the LilyPad to your computer.
- Hand-sewing needle.
Instructions
This project has three basic parts – the textile and hardware, the data, and the code.
Textile and Hardware
- Using a small amount of fabric glue, affix the LilyPad Arduino and vibrating motor to your textile. You are only gluing it to hold it in place while you sew, so not much glue is needed. Set this aside to dry for an hour.
- Once the above is dry, use the conductive thread to sew the connections below. Use small, neat stitches between the petals and make multiple loops of thread around each petal to ensure good contact.
- From the positive petal on the vibrating motor to a numbered petal on the Arduino.
- From the negative petal on the vibrating motor to the negative petal on the Arduino.
- Attach the battery via the JST connector on the LilyPad Arduino. If the battery needs to be charged, you can plug it into your computer via USB while you are working on other parts of the project.
Data Preparation
- Gather as much information about your data set as possible.
- Consider creating a “data biography” to situate your data and restore context (D’Ignazio & Klein 2020, n.p.). Keep in mind that for yourself, preparing the data is part of the process of understanding the phenomenon and honoring the lives behind the data. For others who may access your code, the additional context you can provide may help in the affective shift.
- I’ve created a Data Analysis worksheet based on D’Ignazio & Klein’s work that you may find useful.
- Sort your data by date and, if necessary, time.
Code
In Arduino, the code files are called sketches. You can download a basic sketch to get started from my github repository for this recipe.
- Calculate your basic time unit.
- Identify the span of time that your data covers. Example: 1 year, 1 month, etc.
- Decide how long your project is intended to be worn. How many hours is the event at which you intend it to be worn?
- Calculate your basic time unit. In the Black Ribbon for Mourning project, we were dealing with one year of data (a leap year) to unfold over a four-hour exhibition. Our basic time unit is that one day is equivalent to 39.3 seconds. However, Arduino calculates time in milliseconds. So our basic time unit is 39300.
4 (hours) x 60 (minutes) = 240 minutes
240 (minutes) x 60 (seconds) = 14, 400 seconds
14,400 (seconds) ÷ 366 (days) = 39.3
- Decide how you will handle multiple incidents during the same time period. For Black Ribbon for Mourning, we used multiple one-second pulses to indicate more than one person killed on a day, and longer pulses to indicate more than one person killed in the same incident.
- In a text editor, write an Arduino function using DigitalWrite that turns the vibrating motor on and off for one second (1000 milliseconds), with a delay the length of your basic time unit – 1000. For Black Ribbon for Mourning, ours looks like this:
digitalWrite(Motor, HIGH);
delay(1000);
digitalWrite(Motor, LOW);
delay(38300);
-
-
-
- This would turn the motor on for one second, and off for 38.3 seconds before proceeding to the next instruction. If there was more than one incident on a day, we adjusted the number of pulses and delays accordingly.
-
- To get started in your Arduino sketch, create a “Motor” int (integer) variable and set it to the petal number to which you have attached the vibrating motor on the Arduino.
- In the Setup, define “Motor” as an output.
- In the loop, begin by creating a comment that labels your first time unit. For Black Ribbon for Mourning, this was January 1.
-
- Cut and paste your function from the text editor into your Arduino sketch, adding in comments to contextualize the data. For each high/low function in Black Ribbon for Mourning, I commented in the name of the person killed. As I was going through the data day-by-day, wherever possible I followed the dataset’s link to supporting documents to read about the incident. In some cases, I added additional comments to the code with more information about the person killed.
- Continue adding to your sketch, inserting comments for new time units (days in our case), calculating delays by hand, and commenting in important context. Do this until you have reached the end of your time period.
- I recommend checking the syntax of your code frequently using Arduino’s verify button. In addition, I recommend uploading the code to the Arduino after you have completed coding for a few time units. This allows you to ensure that the vibration motor is operating the way you want it to.
- Once you reach the end of the time period for your data, verify your code and upload it to the Arduino.
References
Benjamin, Ruha. 2020. Race after Technology: Abolitionist Tools for the New Jim Code. Polity Press.
D’Ignazio, C., and Klein, L. 2020. “6. The Numbers Don’t Speak for Themselves.” In Data Feminism, MIT Press. Retrieved from https://data-feminism.mitpress.mit.edu/pub/czq9dfs5
Farrell, Molly. 2016. Counting Bodies: Population in Colonial American Writing. Oxford University Press.
Hartman, Saidiya. (1997) 2022. Scenes of Subjection: Terror, Slavery, and Self-Making in Nineteenth Century America. 25th Anniversary Edition. WW Norton.
Hemmings, Claire. 2012. “Affective Solidarity: Feminist Reflexivity and Political Transformation.” Feminist Theory 13 (2): 147–61.
Hendren, Sara. 2017. “All Technology is Assistive: Six Design Rules on Disability.” In Making Things and Drawing Boundaries, edited by Jentery Sayers, Debates in DH series, U of Minnesota Press.
Hill Collins, Patricia. 2000. Black Feminist Thought: Knowledge, Consciousness, and the Politics of Empowerment. Routledge.
Jefferson, Brian Jordan. 2020. Digitize and Punish: Racial Criminalization in the Digital Age. University of Minnesota Press.
Knight, Kim Brillante. 2018. “‘Danger, Jane Roe!’ Wearable Data Visualization as Feminist Praxis.” In Bodies of Information: Intersectional Feminist Digital Humanities, edited by Jacqueline Wernimont and Elizabeth Losh, University of Minnesota Press.
McKittrick, Katherine. 2021. Dear Science and Other Stories. Duke University Press.
Mirzoeff, Nicholas. 2011. “The Right to Look.” Critical Inquiry 37 (3): 473–96.
Nakamura, Lisa. 2020. “Feeling Good about Feeling Bad: Virtuous Virtual Reality and the Automation of Racial Empathy.” Journal of Visual Culture 19 (1): 47–64.
Kim Brillante Knight
Kim Brillante Knight is an Associate Professor of Digital Humanities at San José State University. Her research centers on intersectional feminist engagements with digital media, including maker culture, wearables, data visualization, viral media, and transgressive utterances. She is the co-founder and ongoing project Director of Fashioning Circuits, a public Humanities project centered on craft, technology, and collectivity in research, teaching, and community partnerships. Her written work has most recently appeared in Hyperrhiz: New Media Cultures, Bodies of Information: Intersectional Feminism and Digital Humanities, and The Routledge Guide to Media Studies and Digital Humanities. Creative work and public scholarship have most recently been highlighted in Making Things and Drawing Boundaries: Experiments in the Digital Humanities and installed at HASTAC 2023. Her forthcoming book Fashioning Makers: Critical Making and Public Humanities is under contract with University of Iowa Press.