Introduction + Backstory
This workshop is designed to provide librarians / library workers / information professionals with an alternative mode to help data learners create their own data visceralization exploration that goes beyond the traditional data visualization methods. By engaging the body, senses, and physical objects in their environment, workshop participants can better relate to seemingly abstract concepts in data, the data processing, and its outputs.
This workshop builds off of my individual data visceralization experiment that was first conceived during a collective research project in 2022 by Carol Choi, Jessika Davis, John Decker, Ava Kaplan, and Lubov McKone, “Making the Desert Island Discs Dataset: Data Visceralization and How We Don’t Know What We Know”(Choi et al. 2022). This project explored alternative modes of representing data, such as materialization and sonification, as a means of connecting critical making and feminized labor to a more visceral understanding of the data itself.
In determining what dataset to use in our project, we focused on a topic that wouldn’t interfere with, nor directly reinforce, the concepts mentioned above. We also wanted to choose a dataset that had already been through the Digital Humanities research cycle (in promotion of the concept of reproducibility in the field). In the Knowledge Commons (aka Humanities Commons) we found our dataset, Desert Island Disks (Finnegan, Rangel Smith, and Van Stroud 2021), which built upon Desert Island Discs 1942-2020(Gustar 2020), which in turn builds on BBC Desert Island Discs Dataset v 1.0 (Morgan 2018). You can read more about it on our “Data Choice” project page.
This dataset represents data from the long running BBC radio show Desert Island Discs, where the hosts ask their invited guests (“castaways”) which 8 songs they would like to have accompany them if they were marooned on a desert island. Over the years captured in the dataset, 1942-2021, the top 8 songs the guests chose ended up being by classical composers:
- Wolfgang Amadeus Mozart
- Ludwig Van Beethoven
- Johann Sebastian Bach
- Franz Schubert
- Giuseppe Verdi
- Edward Elgar
- Pyotr Ilyich Tchaikovsky
- Giacomo Puccini
Top 8 Journey
The visceralization experiment served as an exploratory exercise to transform data from a one-dimensional realm into a physical (visual / tactile) and aural experience. Aptly titled Top 8, my individual experiment focused on the relationship between the program guests and the artists of their 8 song choices. To translate the data to a final output, I was confronted with many unexpected considerations that needed to be negotiated in terms of how we think about, utilize, and communicate our data process, specifically the ideas of “choice” and “absence.” Cat Hicks discussed the absence when processing data for an intended outcome, “Sometimes I like to call this ‘when we miss missingness,’ a quip to remind myself that we need to understand data not just in terms of datasets but in terms of the context around it. We need to ask what data was collected and, perhaps more importantly, what data was left out.”(Hicks 2022)
Working through those considerations, the experiment has evolved from the first iteration, a table-top proof of concept (Figure 1), to a second iteration, a life-sized version that was installed as an exhibition (Figure 2).
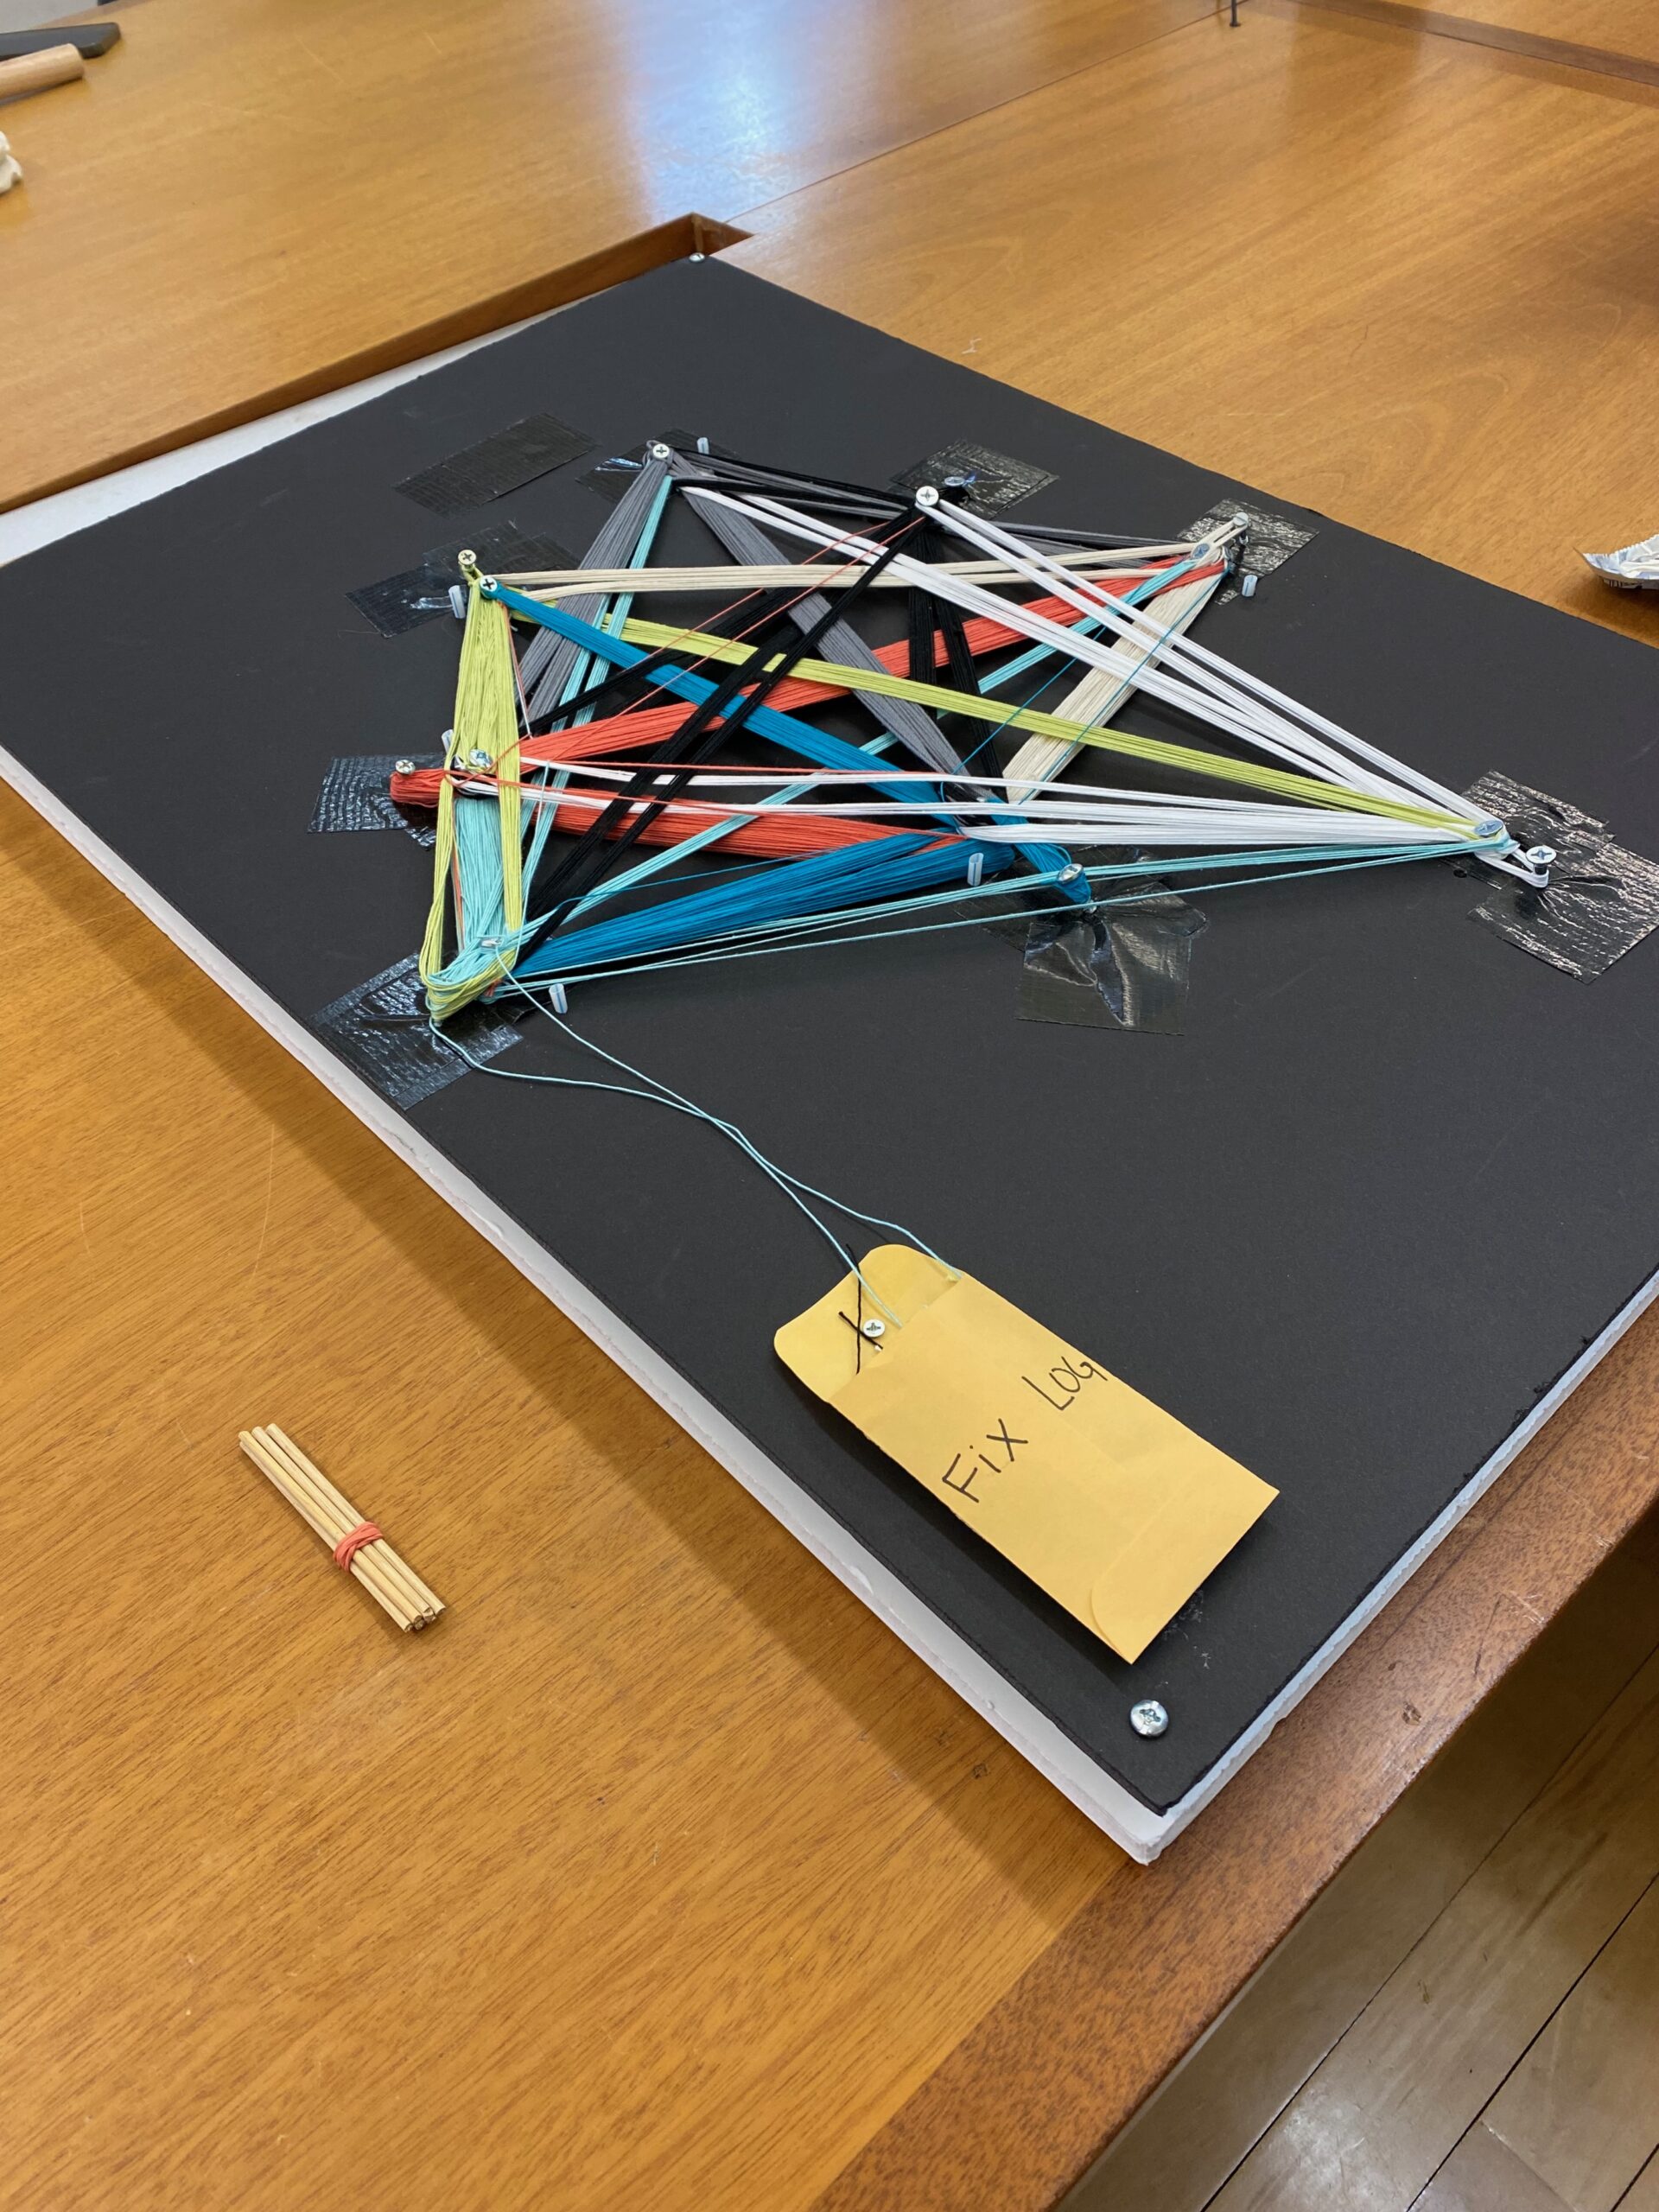
Figure 1. The first physicalized / sonified iteration for the individual “visceralization”, Top 8, from the “Making the Desert Island Discs Dataset: Data Visceralization and How We Don’t Know What We Know” Project in 2022. This output consisted of poster and foam board layers, crochet thread, screws, tape, sonification of labels via mini-recordable sound devices, penned dots on paper (when audiences ran their fingers against the underside of the board, they felt the raised texture of each dot, which signified the data not used in the network physicalization).
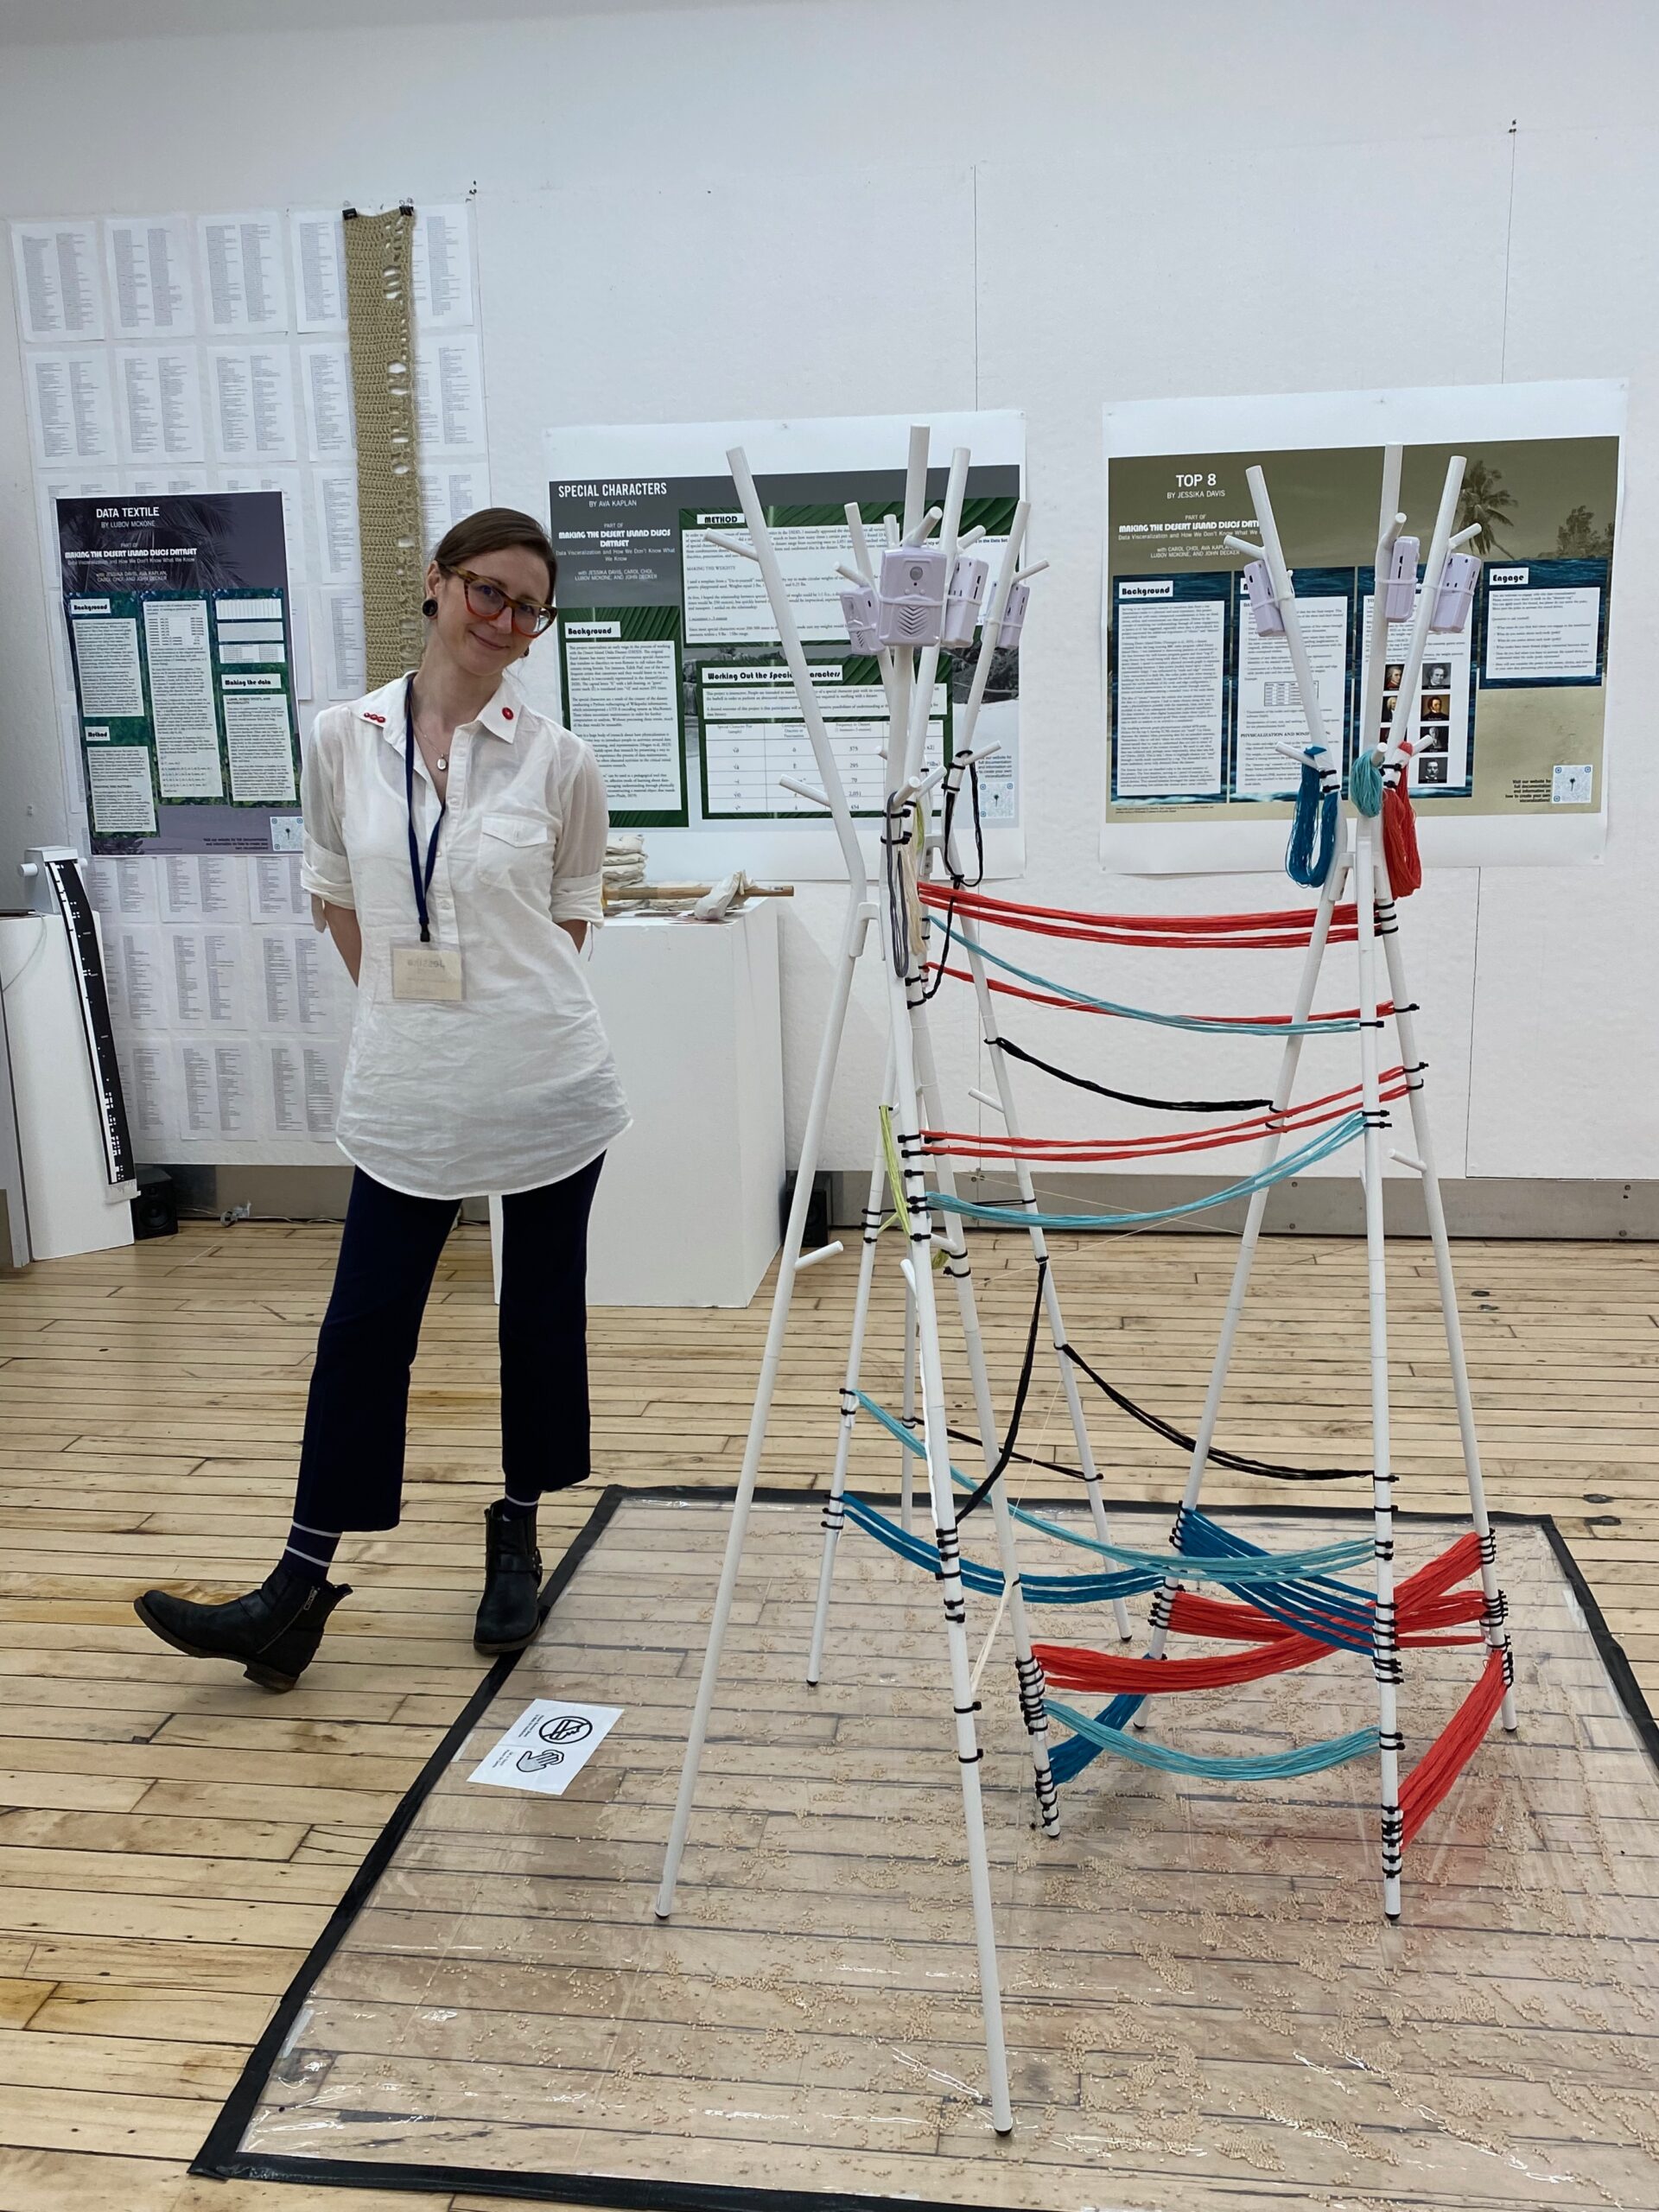
Figure 2. The second physicalized / sonified iteration for the individual “visceralization”, Top 8, from the “Making the Desert Island Discs Dataset: Data Visceralization and How We Don’t Know What We Know” project as presented at HASTAC 2023. This output consisted of metal coat racks, passive infrared (PIR) motion sensor-activated sound players, thread, tape, zip ties, and an “absence rug” consisting of not used choices/data points – 1:1 count of matpe beans – between plastic sheets.
My past iterations and this workshop builds from previous explorations of how engaging our senses can enrich understanding, particularly when data moves from flat visualizations into three-dimensional space (Jansen et al. 2015). I’m particularly interested in how our physical bodies, working in concert with all our senses, can create new layers of understanding. This approach draws on embodied cognition—the idea that “our cognitive activities are anchored by our sensorimotor interactions with our surroundings” (Wilson 2002; Noë 2006; Barsalou 2008; Zhu et al. 2023). Wilson’s framework identifies six dimensions of embodied cognition, including how cognition is situated in physical contexts, how we off-load cognitive work onto our environment, and how even our abstract thinking is grounded in bodily experience (Wilson 2002). In this third iteration of my work, I wanted to experiment specifically with how physical engagement affects sense-making and data interpretation. When we process information, our minds aren’t working in isolation—we’re constantly navigating between abstract data and concrete experience, encoding and decoding meaning through multiple dimensions simultaneously. Physical objects act as bridges in this process, grounding abstract concepts and encouraging exploration.
Definitions
Before we dive in, here’s an overview of some of the key terms and concepts that will be used during the workshop:
The output of this workshop and the previous iterations assume the form of a network graph, which can be defined as a map of concepts or things (nodes) that are connected by some sort of shared relationship (edges). Network graphs can help understand and analyze commonalities, differences, missingness (or absence), and the complex patterns in communities existing within these concepts and things.
It is important to note that my aim was to visceralize a network graph, not just visualize one. What does that even mean? In the early 2000s, the concept of “data visceralization” was thought to be introduced through Kelly Dobson’s work on the Data Visceralization Project at Rhode Island School of Design (RISD). Her project called into question the over-reliance of data visualization as the singular pipeline to understanding what the data represented. Data visualization tends to make audiences feel like they are in control, while also being detached observers of (rather than participants with) the information. The term was “later popularized by Luke Stark” (WERNIMONT 2021) (Greenhalgh 2022). Stark defined data visceralizations as the “representations of information [that] rely on multiple senses including touch, smell, and even taste, [which] work together to stimulate our feelings as well as our thoughts.”(Stark 2014)
To me, data visceralization connects and uses our physical body to map understanding from abstract concepts to the tangible world around us – even weaving in feelings and emotions.
Data Transparency
In the spirit of communicating data processing actions clearly and transparently, I share a bit about the steps I took and considerations I made to accommodate potential limitations around time, space, and what is realistically feasible with a human body.
The workshop picks up from the already processed dataset utilized for “Top 8” iterations mentioned above, which centered around the top 8 artist occurrences (total = 4478) which the BBC guests chose from 1942-2021. The pared-down dataset will just consider the time period of 1990-1999 (total = 678). This will still allow for experiencing the data in the original project configuration, but at a smaller scale to allow time for everyone to participate in the full workshop activity. The new pared-down dataset is available for download and can be reviewed at during the workshop. There is another step of data processing that is needed to transform the data into a network graph.
To transform raw data into a network graph, a nodes and edge table needs to be constructed to prepare the data according to the types of relationships you want to show in that network graph format. To build that table, I used the same Python script utilized in the previous iteration (changing out the file directories as needed). This updated Python script generates a nodes and edge table (nodes pair and the connecting edges with weight). The artists are represented as the nodes and the edges are the co-occurrence of any 2 choices. The weight is the frequency of the occurrence.
For instance, when a “castaway” chose Mozart and Bach in their top 8, that was considered one edge weight which connected those 2 nodes. The more times the guests chose that same pattern, the weight of the edge increased. For the sake of transparency, and to ease workshop facilitation, I have included all the “already processed” files in the GitHub repository.
Another important calculation to call out is that of the Absence: the data not selected from the dataset to construct the network graph. So, for the first and second iterations, the calculation was to take the total number of rows (all 8 choices through the years of 1942-2021) 26260 and subtract from that the 4478 rows I used in the network graph (only the occurrences of the “top 8” artists from 1942-2021) which yielded 21,782 rows not “used”, i.e. the absence.
For the pared down workshop version of the dataset, the calculation is as follows: 4478 (only the occurrences of the “top 8” artists from 1942-2021) minus the 678 rows of the “top 8” artist occurrences from the date range of 1990-1999 which yields 3,800 data points not considered in the construction of the human network graph visceralization, i.e. the absence.
TL;DR
The first 2 iterations called out an absence (data not used in the final network graph output) that totaled 21,782 data points. This workshop iteration follows the same data processing steps, but considers a smaller subset of that data, which decreases the total absence to 3,800 data points. This is important to highlight in keeping with the spirit of the themes of the project – transparency and choice.
It took extensive trial and error to determine the most manageable population data for the all the physicalization efforts. The original project team processed the data in OpenRefine to combine similar values through text facets, clustering, and the removal of special character encodings and transformation into their proper diacritics. Additionally, manual visual checks were performed to group different values representing the same concept, including variations in name spelling (anglicization vs original), capitalization, spacing, and punctuation. I welcome you to view the entire data processing steps (all 6+ trials…) from the start of the original project “Making the Desert Island Discs Dataset: Data Visceralization and How We Don’t Know What We Know,”(Choi et al. 2022). You can follow the full data processing for the “Top 8” under the Technical Process header.
Framework
The workshop / activity employs the framework of data literacy and is inspired by the design principles set forth by Rahul Bhargava and Catherine D’Ignazio in their 2015 paper, “Designing Tools and Activities for Data Literacy Learners,” in which they describe data literacy as including “the ability to read, work with, analyze and argue with data”(Bhargava and D’Ignazio 2015).
Reading data asks the person to connect their understanding of the data to real-life concepts. Working with data involves the activities and actions taken with data directly (processing, generating, maintaining it, etc.). Analyzing the data involves re-ordering the data in such a way to compare/contrast and perform other evaluations. Arguing with the data demands the construction of a larger story outlining what the data is actually saying to a targeted group of people(Bhargava and D’Ignazio 2015). I directly connected this framework to the workshop activity steps below.
Bhargava and D’Ignazo also highlight the importance of transparency throughout the steps mentioned above, which help data learners connect the concepts to the domain-specific language utilized. They propose “activities that support learners must be focused, guided, inviting, and expandable.”(Bhargava and D’Ignazio 2015)
Building off their 2015 research to better support data literacy learners, Catherine D’Ignazio introduces the concept of creative data literacy and argues that non-technical types of learners “may need pathways towards data which do not come from technical fields” (D’Ignazio 2017). She emphasizes that multiple actors, such as “data creators, data publishers, tool developers, tool and visualization designers, tutorial authors, government, community organizers and artists” (D’Ignazio 2017), should be charged with facilitating creative data literacy.
Goals and Hopeful Outcomes
I hope that by engaging a constellation of senses (aural, touch, and visual) not typically used in conceptualizing data, participants will come away with increased data literacy, and in turn, a new awareness of how data can be transformed, processed, or removed. By employing tactics of embodied cognition (using the body to help form new understandings between the external world and internal thought), transparency of process, and the data literacy principles of Rahul Bhargava and Catherine D’Ignazio, I hope participants will better understand what that data means after experiencing it with their bodies. Maybe this will spark your own curiosity to transform data into the physical and aural realm. So, I leave you with this question:
How will you consider the power of the senses, choice, and absence in your own data processing after experiencing this project?
Workshop Activity
Note before starting: This workshop will require the participants to sit or stand for a period of time and it is recommended that the space have chairs available if people need to alternate between standing and sitting. The facilitator can also check in with the participants throughout the workshop to see if they need to take short breaks or switch positions. Additionally, it is recommended for the participants to wear comfortable clothes.
Potential trigger warning: the thread will be wound around the arms, legs, and mid section of the participants – connecting one participant to another. Participants will be in close proximity to each other, but if there are any feelings of discomfort, they can engage the facilitator. The participants should feel safe and empowered to remove themselves from the activity (i.e. the thread) at any time. The facilitator should also be on the lookout for signs of discomfort with the participants and intervene as necessary.
Time Frames
- Preparation for the workshop:
- Collecting recycled materials (for the absence) over a couple days/weeks prior to the workshop.
- Cutting up the absence: For one person, it takes approximately 7 hours to cut 3,800 pieces of the recycled materials. If this task can be split up between the participants, it will diminish the total time (for example, with 8 people, it would take a total of ~55 minutes to cut 3,800 pieces).
- Workshop duration:
- Activity: ~3 hours for main activity
- Post activity discussion: ~30 minutes
- Clean up: ~20 minutes
What is needed
- An open space/room that can accommodate at least 10 people situated at about an arm’s length from each other
- Laptop (optional: projector) arranged so that participants can see the screen (by either taking turns or passing around the device)
- Another use for the laptop is to play music during the workshop activity. In the trial run, one of the participants put on a streaming music platform and played a mix of classical composers (many of them were the nodes in this dataset). The participants reported how it helped them get transported into a more focused state.
- At least one facilitator
- 8 Data Players (participants enacting the network graph- the nodes)*
- At least 2 Data Makers (participants stringing the crochet thread – the edges – from Data Player to Data Player)**
- Thread (for example, Aunt Lydia’s Crochet Thread Classic 10 or 3 ) in 8 different colors
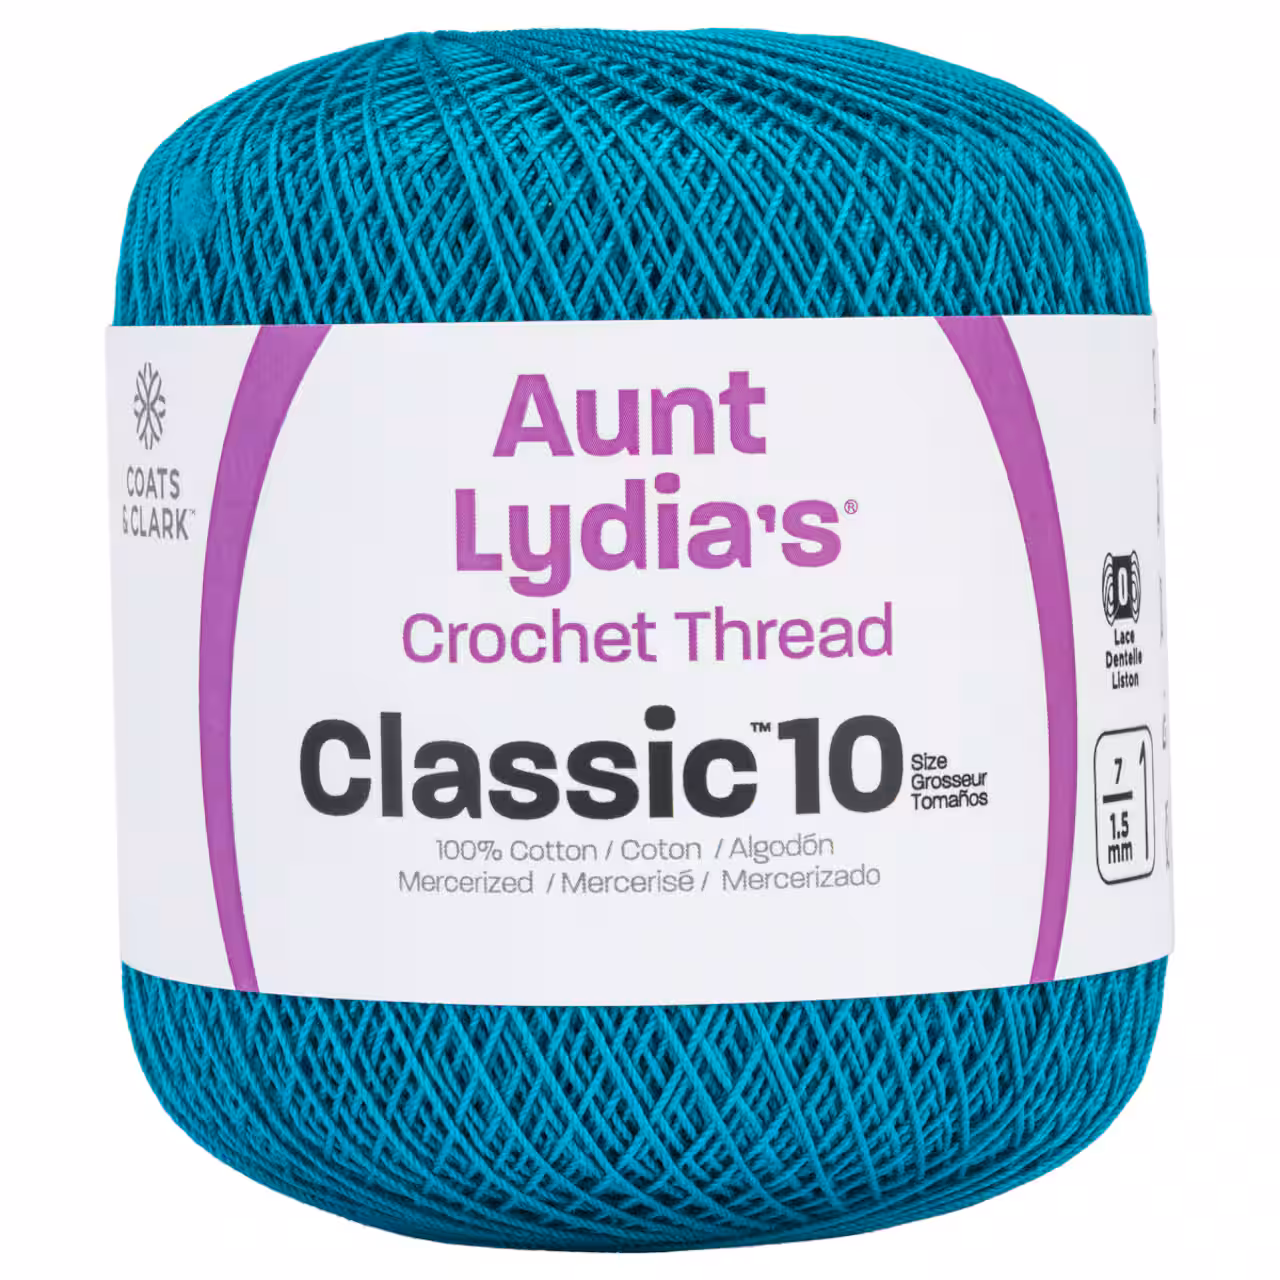
Figure 3. Example of the crochet thread brand, Aunt Lydia’s Crochet Thread Classic 10.
- Absence Material– material that you can get in high volume and can be walked on (like paper crumpled up into balls, cut up cardboard such as soda can cases, cut up toilet paper rolls, etc)

Figure 4. Examples of cut up recycled material, like cardboard soda can case or toilet paper roll. Depending on the Absence Material quantity needed and amount of resources that can be collected for the workshop, you will need to make decisions about how large or small to cut the pieces to get the amount required.
- Scissors to cut the thread (ideally one pair per “Data Maker” role)
- Potential other materials needed:
- Masking tape or binder clips of assorted sizes (to secure the thread loops on the body / clothing if need be, although tension between to people should be enough to keep the thread stay put)
- Printed out copies of the nodes and edges table to pass around to all the participants. It is helpful for the facilitator to also have a copy to keep track of the counts of thread wrapped between the nodes.
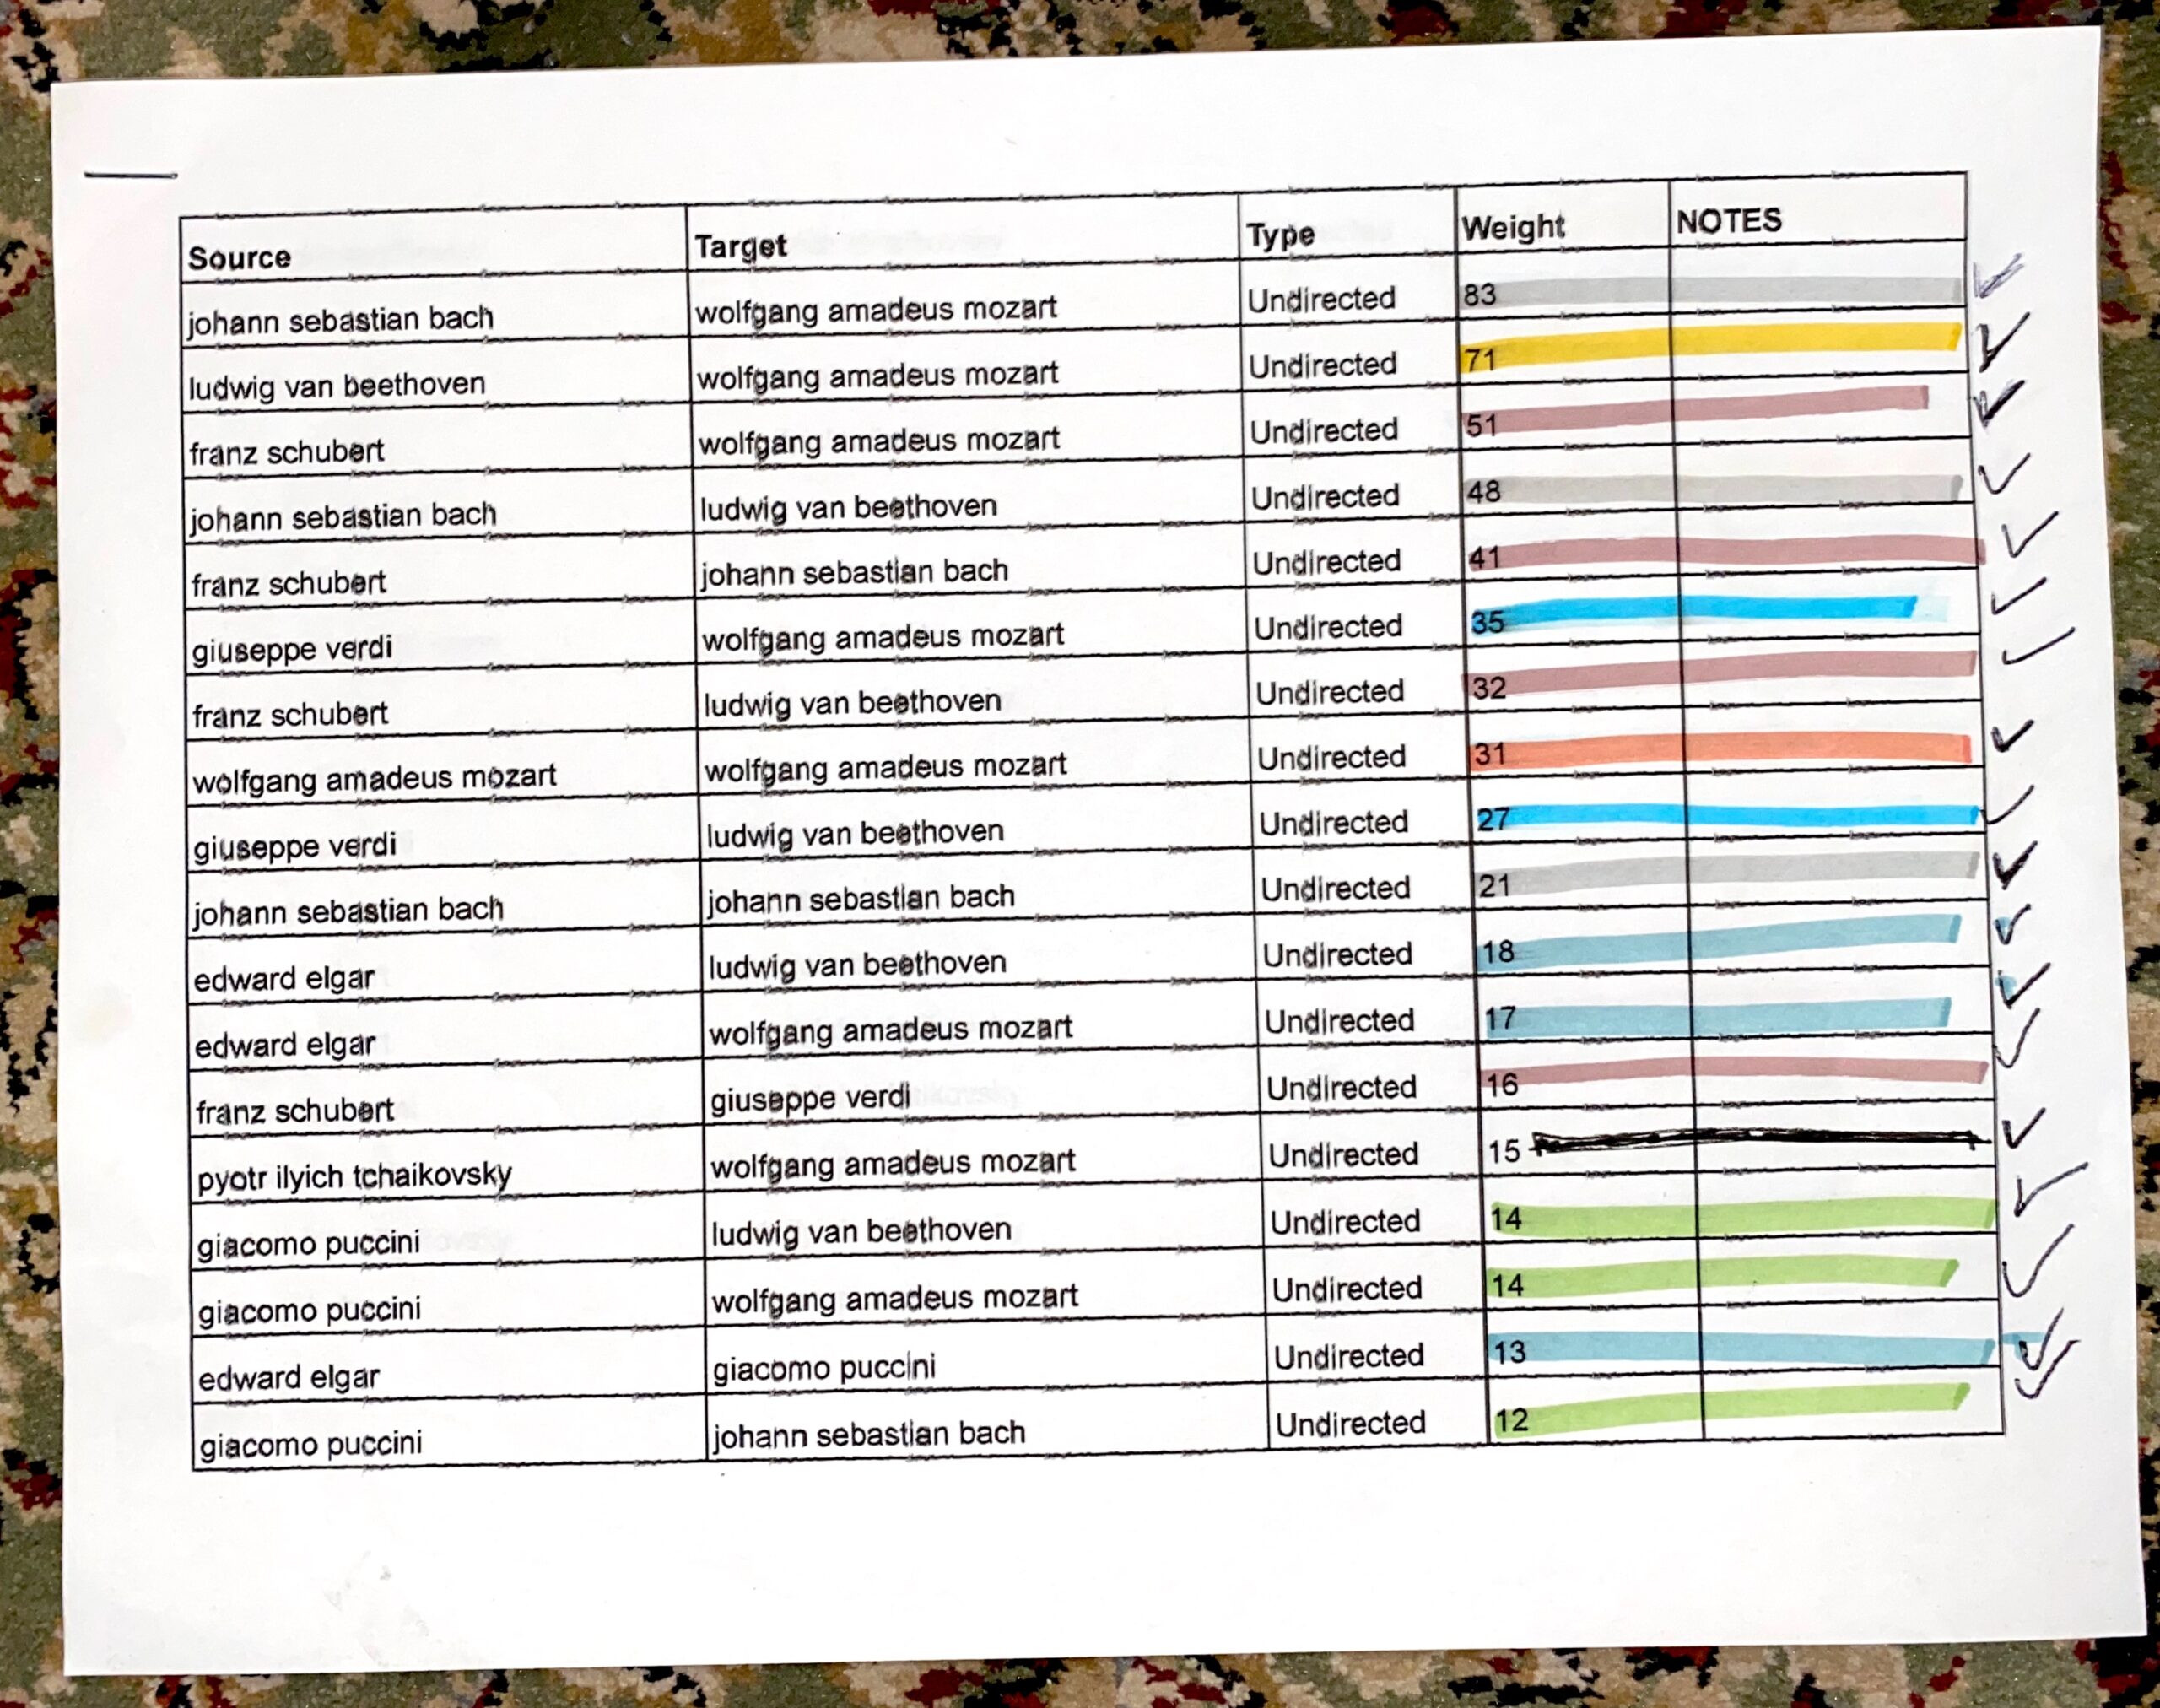
Figure 5. If a laptop can’t be made available for the workshop, a print out copy of the nodes and edge table file can be used as the “blueprint” to wrap the thread between nodes. Here the rows are highlighted in the color of the corresponding thread and checked off after the wrapping was completed.
Activity
- Data Processing/ Preparation ((read)) and ((work with))
- The facilitator will introduce the project by discussing these points:
- Share the trigger warnings* / accessibility notes** above.
- Restate the information above in the Introduction and Backstory. This workshop is based on an existing project with multiple iterations that build from each other. That body of that work focuses on themes of feminization of labor, critical making as a means to knowledge-making, challenging the over reliance on creating visualizations to understand data (and the concepts it would represent), and the importance of communicating about choices and absence during the processing of data.
- Talk through the key definitions mentioned above: network graph and visceralize / visceralization.
- Data transparency: This dataset has been worked with by different people at different times, those people made choices along the way that impact what is seen or not seen in the data output, and the data has been processed to optimize grouping like concepts and to mitigate encoding errors at time of data extraction (see “Individual Data Processing” section in the original project for more detail).
- Share / show the data that will used to support this workshop: This is the parsed down data set (1990-1999) and the Python script that generated the nodes and edges table, which serves as the blueprint to determine how many times the thread needs to be wrapped around the 8 Data Players’ arms, legs, and torsos (connecting one Data Player to another Data Player).
- The participants can collectively decide which color will be assigned to which Top 8 artist nodes: Wolfgang Amadeus Mozart, Ludwig Van Beethoven, Johann Sebastian Bach, Franz Schubert, Giuseppe Verdi, Edward Elgar, Pyotr Ilyich Tchaikovsky, and Giacomo Puccini.
- The facilitator will introduce the project by discussing these points:
- “Absence” Creation ((analyze))
- Depending on the amount of Absence Material that has been collected and the time allowed for the workshop session, decide what the ratio will be used to represent the “Absence”. For instance, if there has been a lot of material collected and the participants are able to dedicate time to cutting up the material, you can attempt a 1:1 ratio of material piece to data point not used. If time and materials are more limited, try using a different ratio like 1:2 or 1:5 (1 material piece represents 2 or 5 data points not used).
- Examples:
- 3,800 material pieces needed if using the ratio 1:1
- 1,200 material pieces needed if using the ratio 1:2
- 760 material pieces needed if using the ratio 1:5
- Save this material for distribution for the very end of the workshop (post completion of the human network graph construction.
- Constructing the Human Network Graph ((analyze))
- The 8 Data Players place themselves in a spread-out formation:
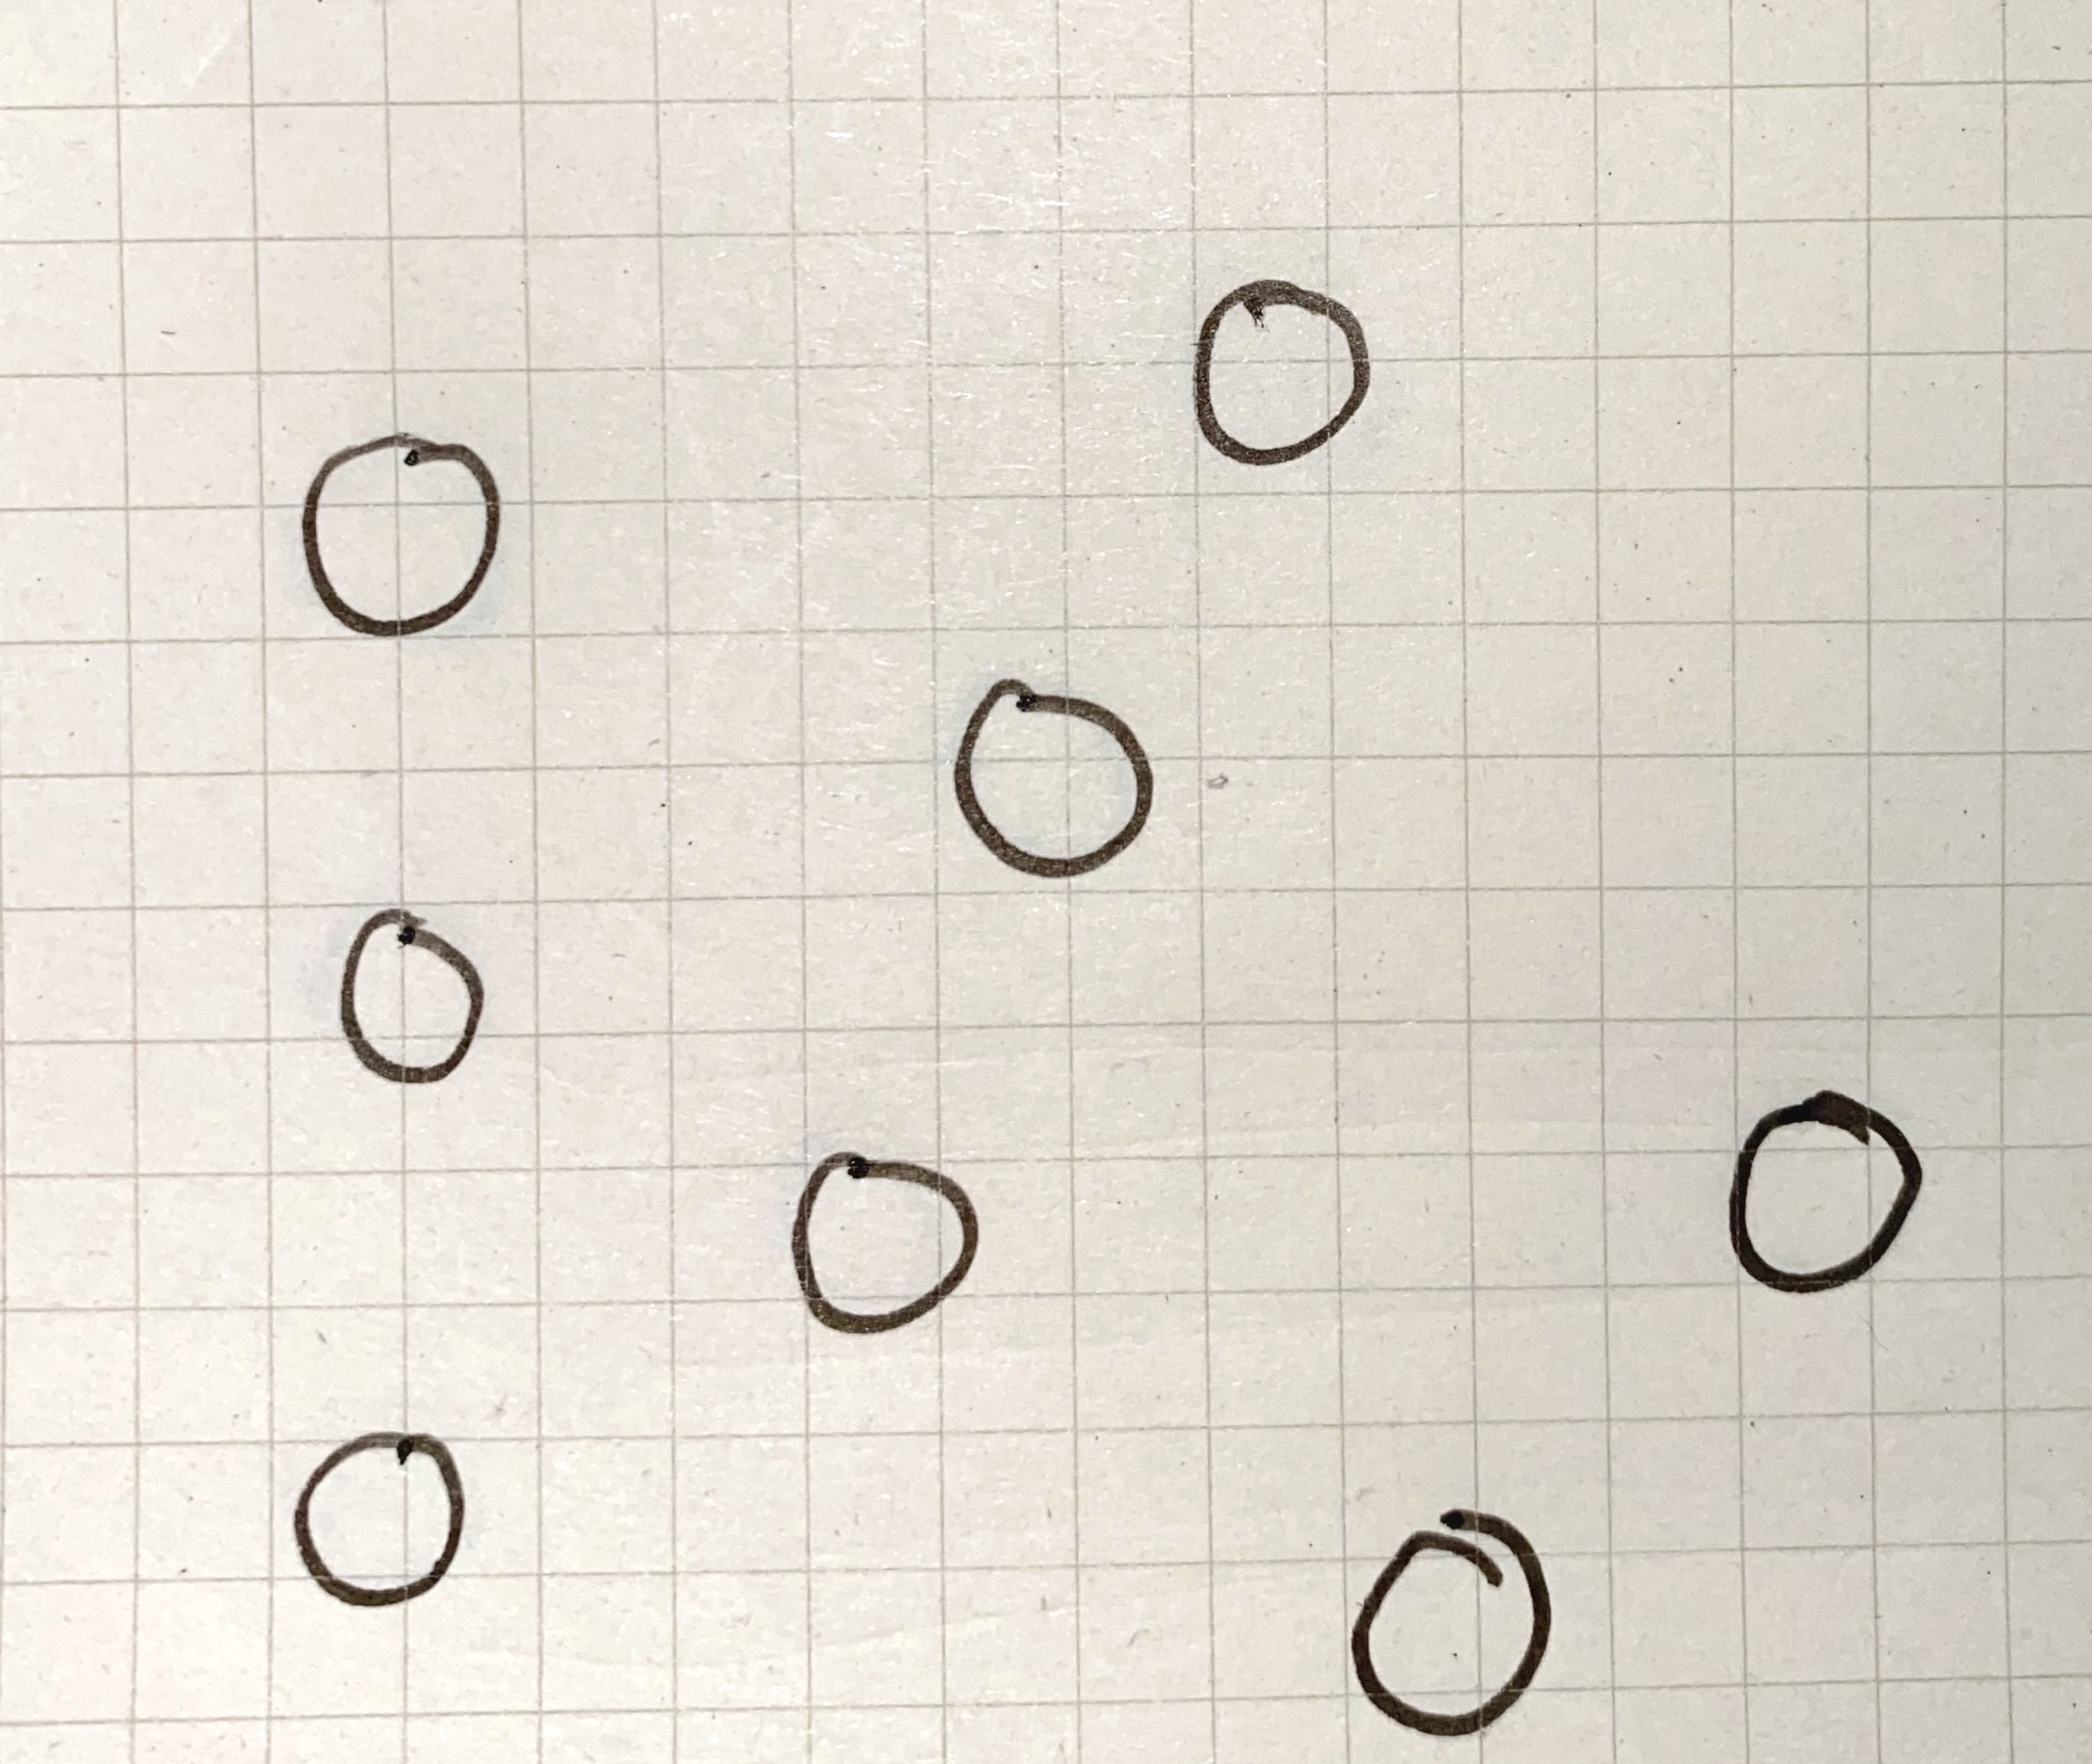
Figure 6. Overview sketch of the staggered formation of the participant nodes in the activity space.
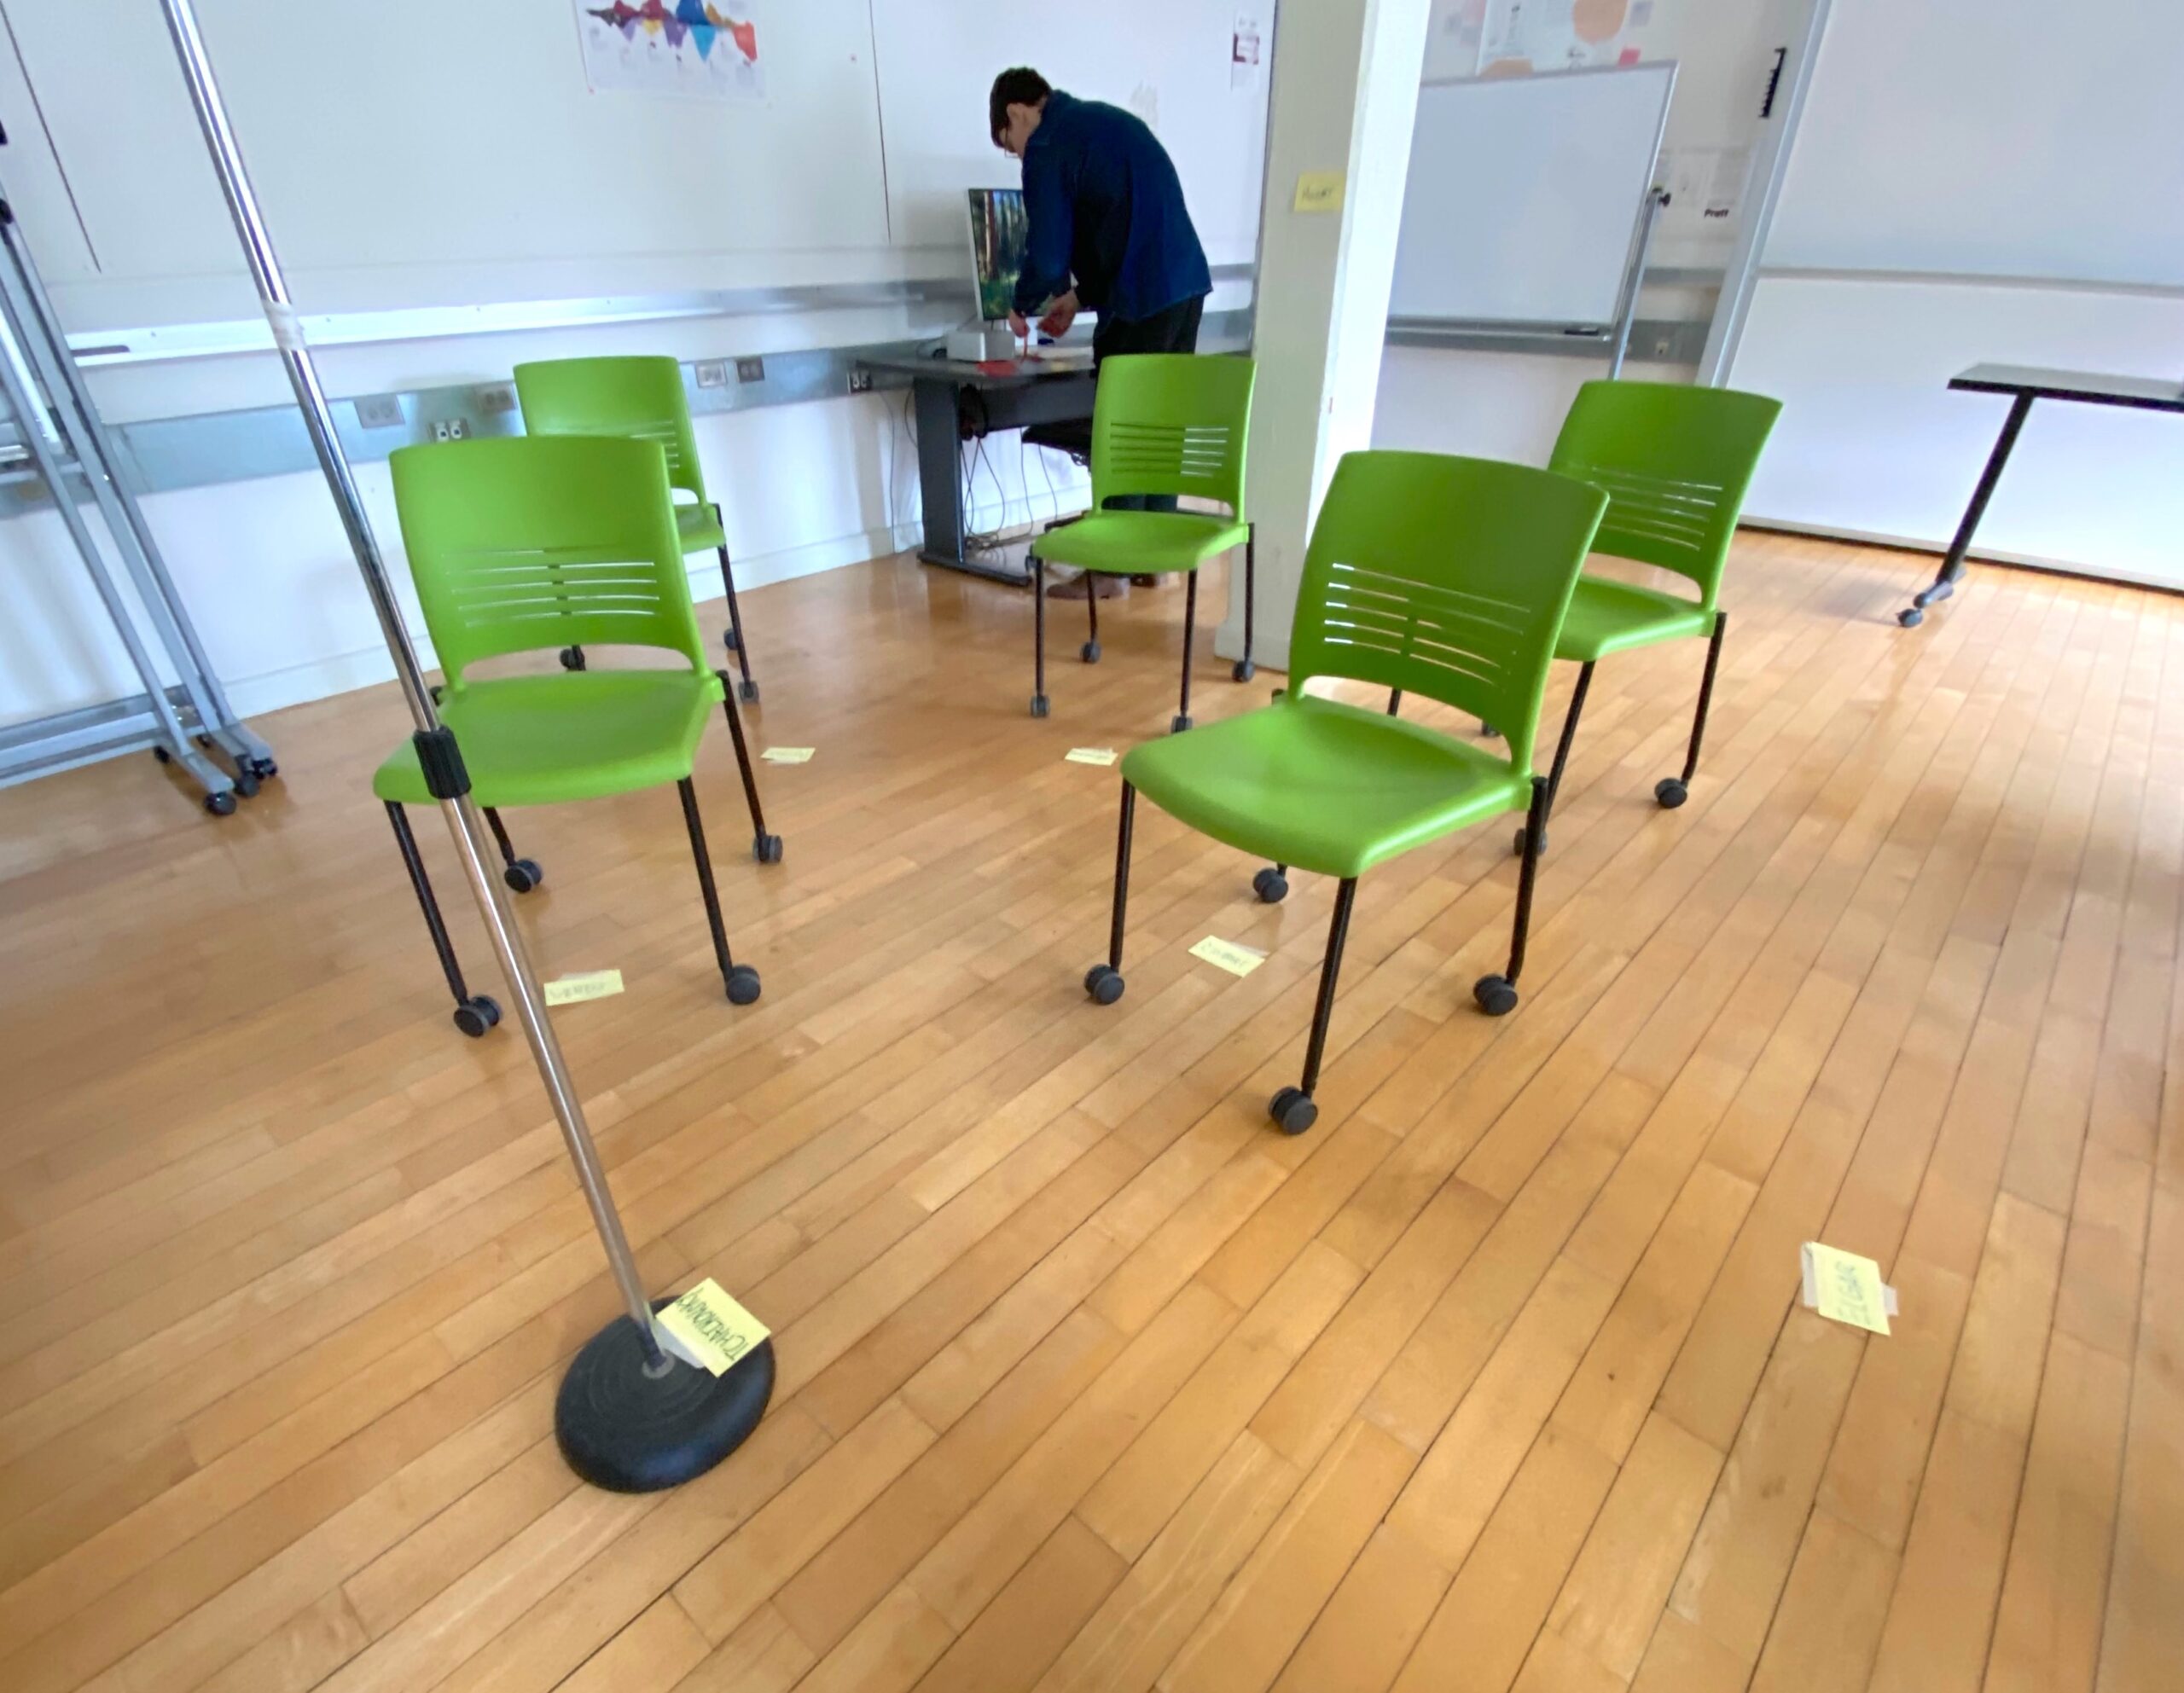
Figure 7. Chairs and a mic stand serve as a placeholder for the participants in preparation to build the human network graph.
- Each Data Player adopts one of the 8 Top artist nodes.
- The Data Makers will then follow the node and edges table to connect the Data Players to each other with the string.
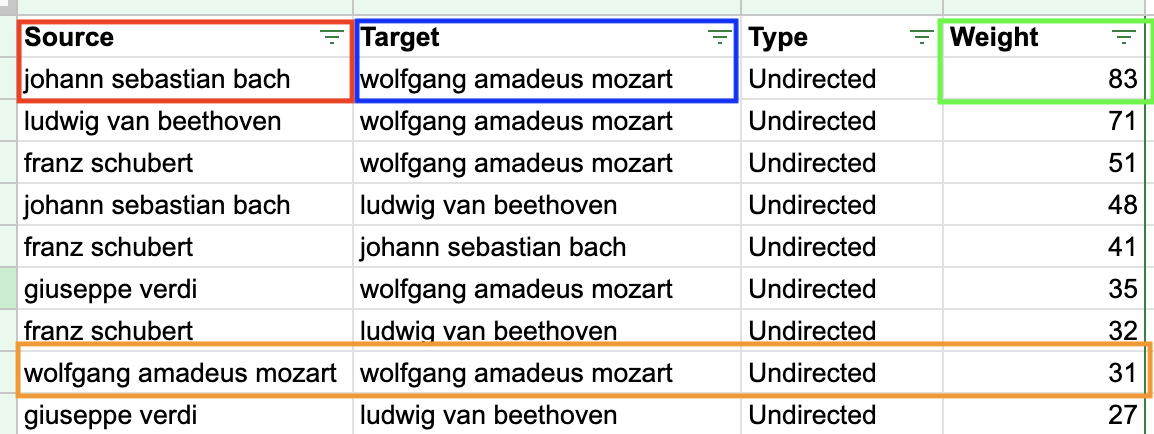
Figure 8. Detail of the node and edges table in Google sheets that displays the key components of the table, source, target, weight, and an example of a recursive pair occurrence.
- Source = the node to start the thread wrapping, this also denotes the color thread to use (reference step 1b).
- Tip for the wrapping: first tie the end of the string to the body of the source node (not too tight, but tight enough so it should stay at the level securely). You might want to use a binder clip to the participant’s clothes or masking tape if skin is bare to secure this first attachment.
- Target = the node that the thread will be wrapped around after the Source node, then returning back to the Source node or terminating there, depending on the Weight.
- Weight = the number of times the thread will pass between the 2 nodes.
- This first connection from Source node to Target node counts as a Weight of 1. When the thread is brought back to the Source node, that increases the Weight to a count of 2. Continue this path until the final count is met according to the node and edges table.
- You may encounter a Source and Target pair that is the same. This means the artist existed multiple times in a guest’s top 8 choice or just by itself. This scenario can be referred to as a recursive relationship, meaning it evokes or references itself in the prescribed relationship (“Recursion” 2025).
- The Data Makers will construct the recursive loop as either a necklace, crown, or headband (or Data Player’s choice) for each Data Player.
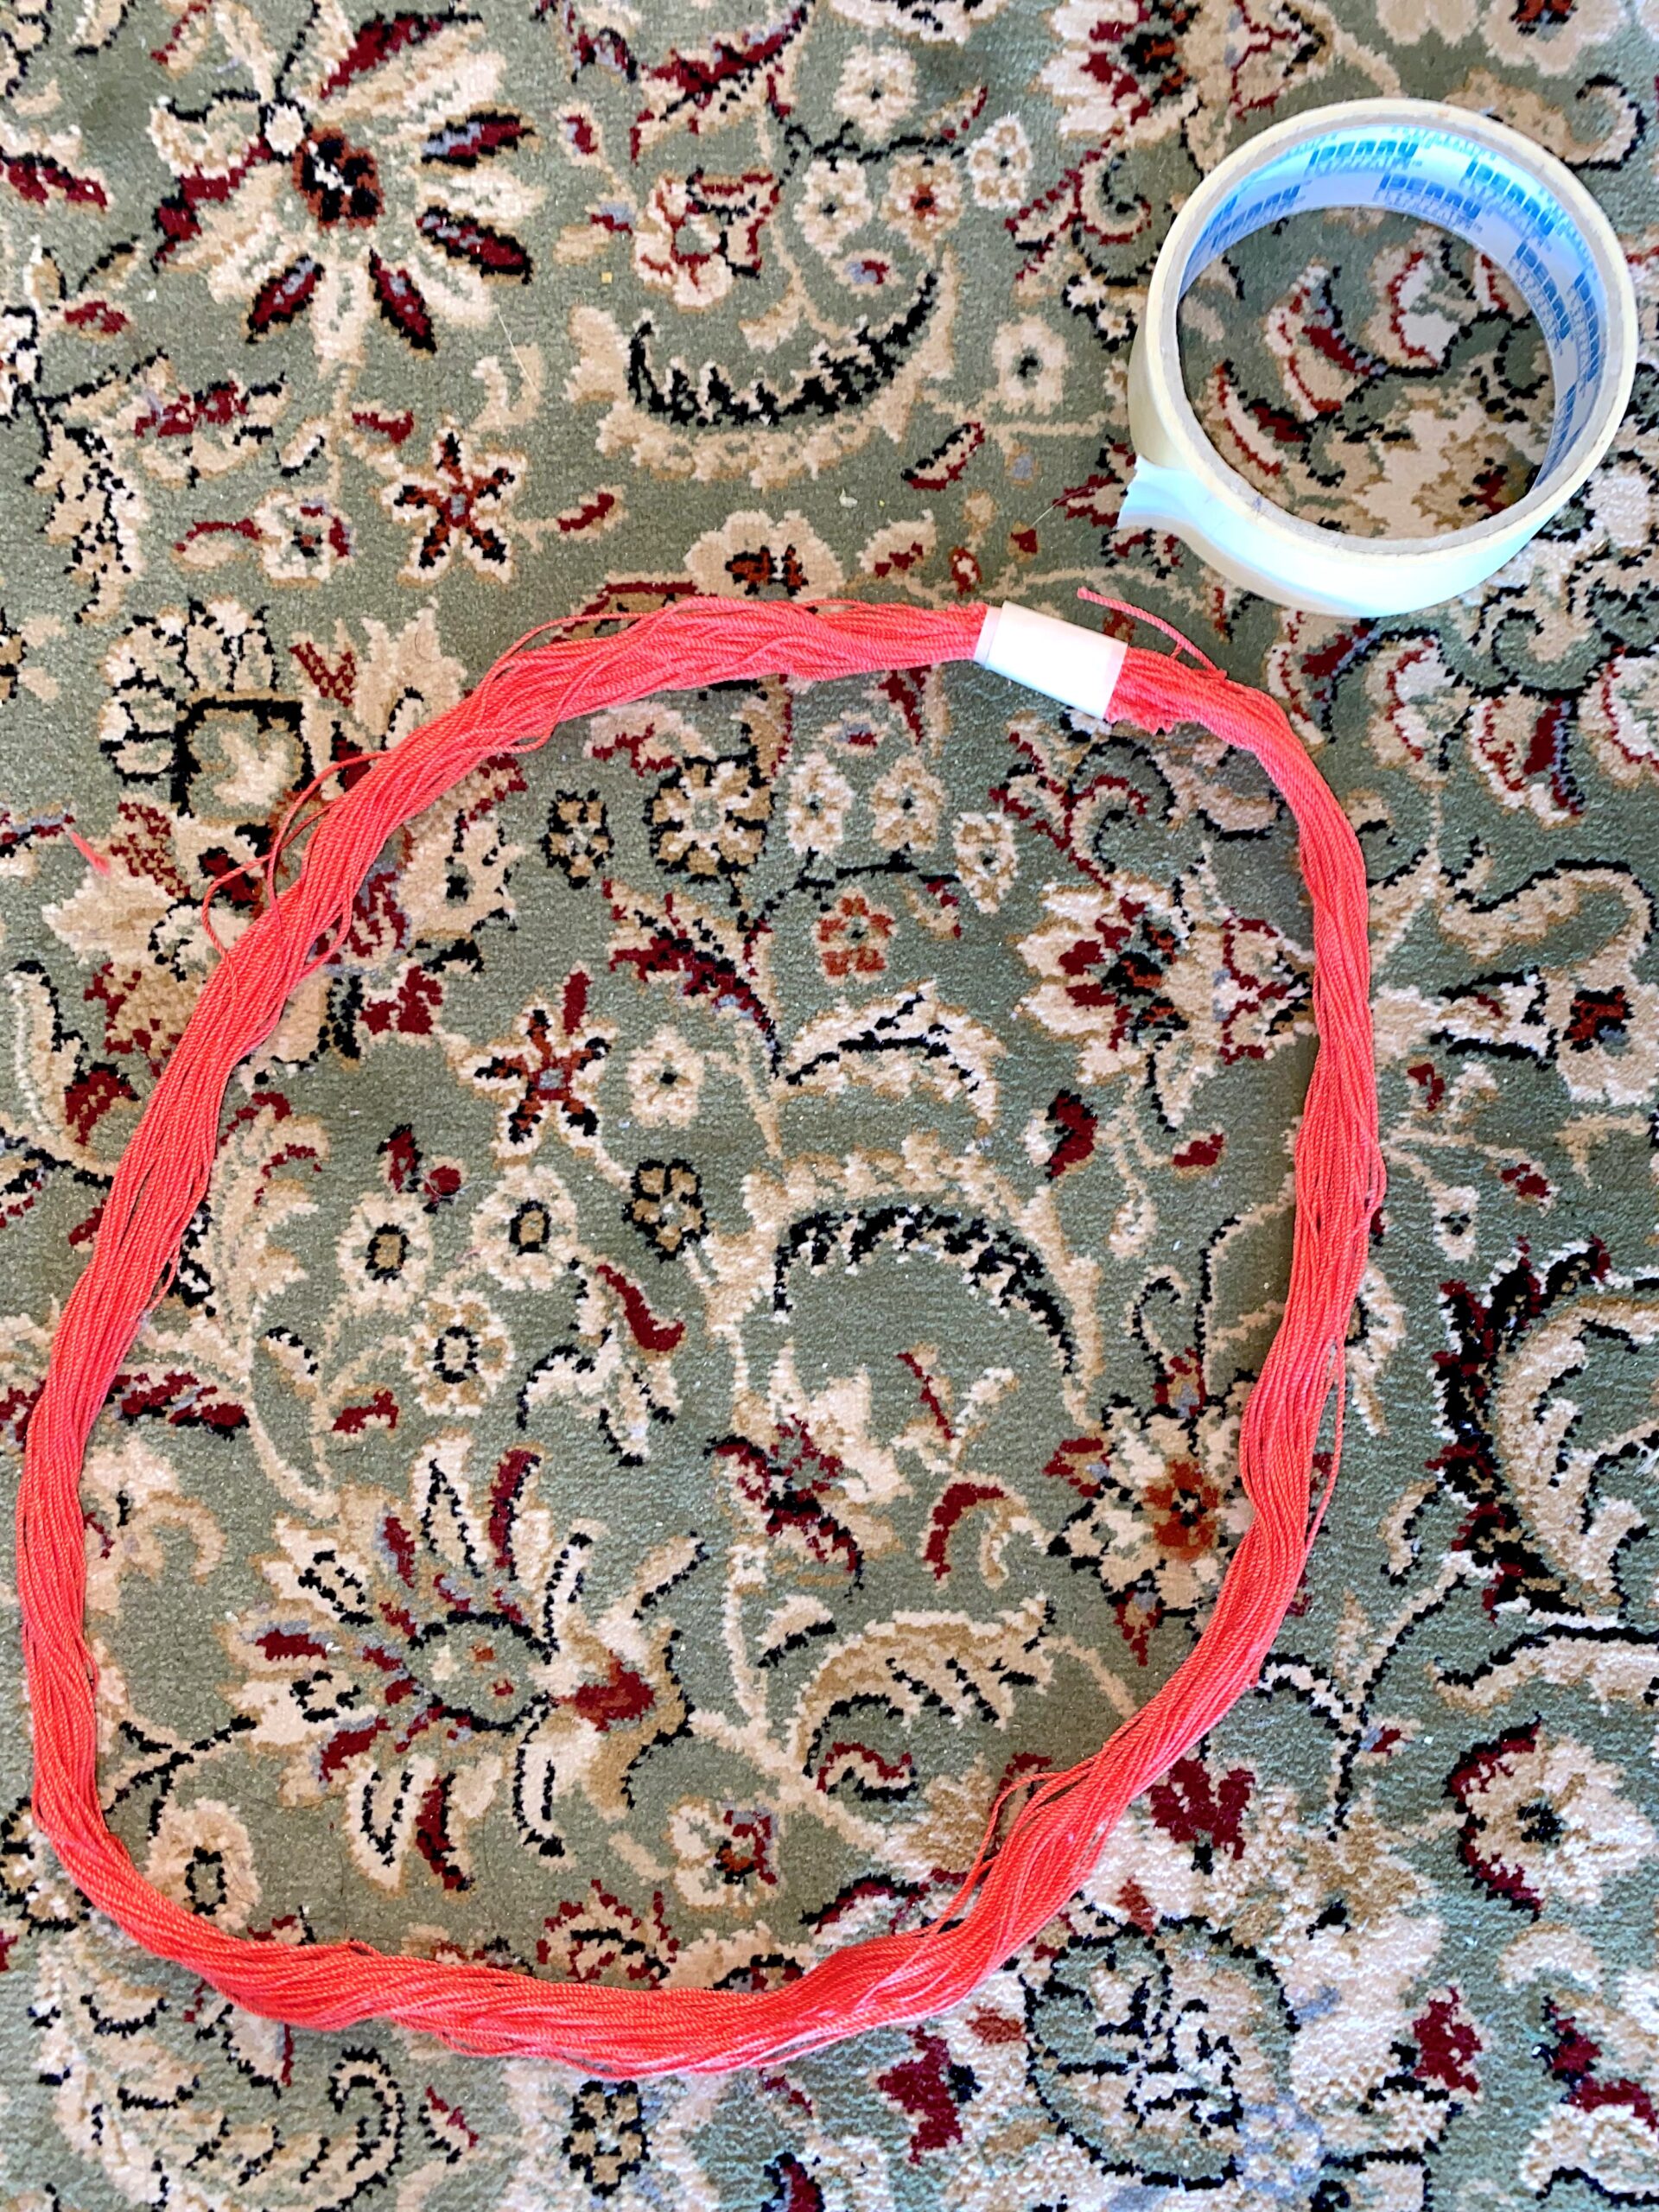
Figure 9. An example of a recursive loop (aka crown) – which is comprised of multiple lengths of string, cut to the same length, and joined together by masking tape.
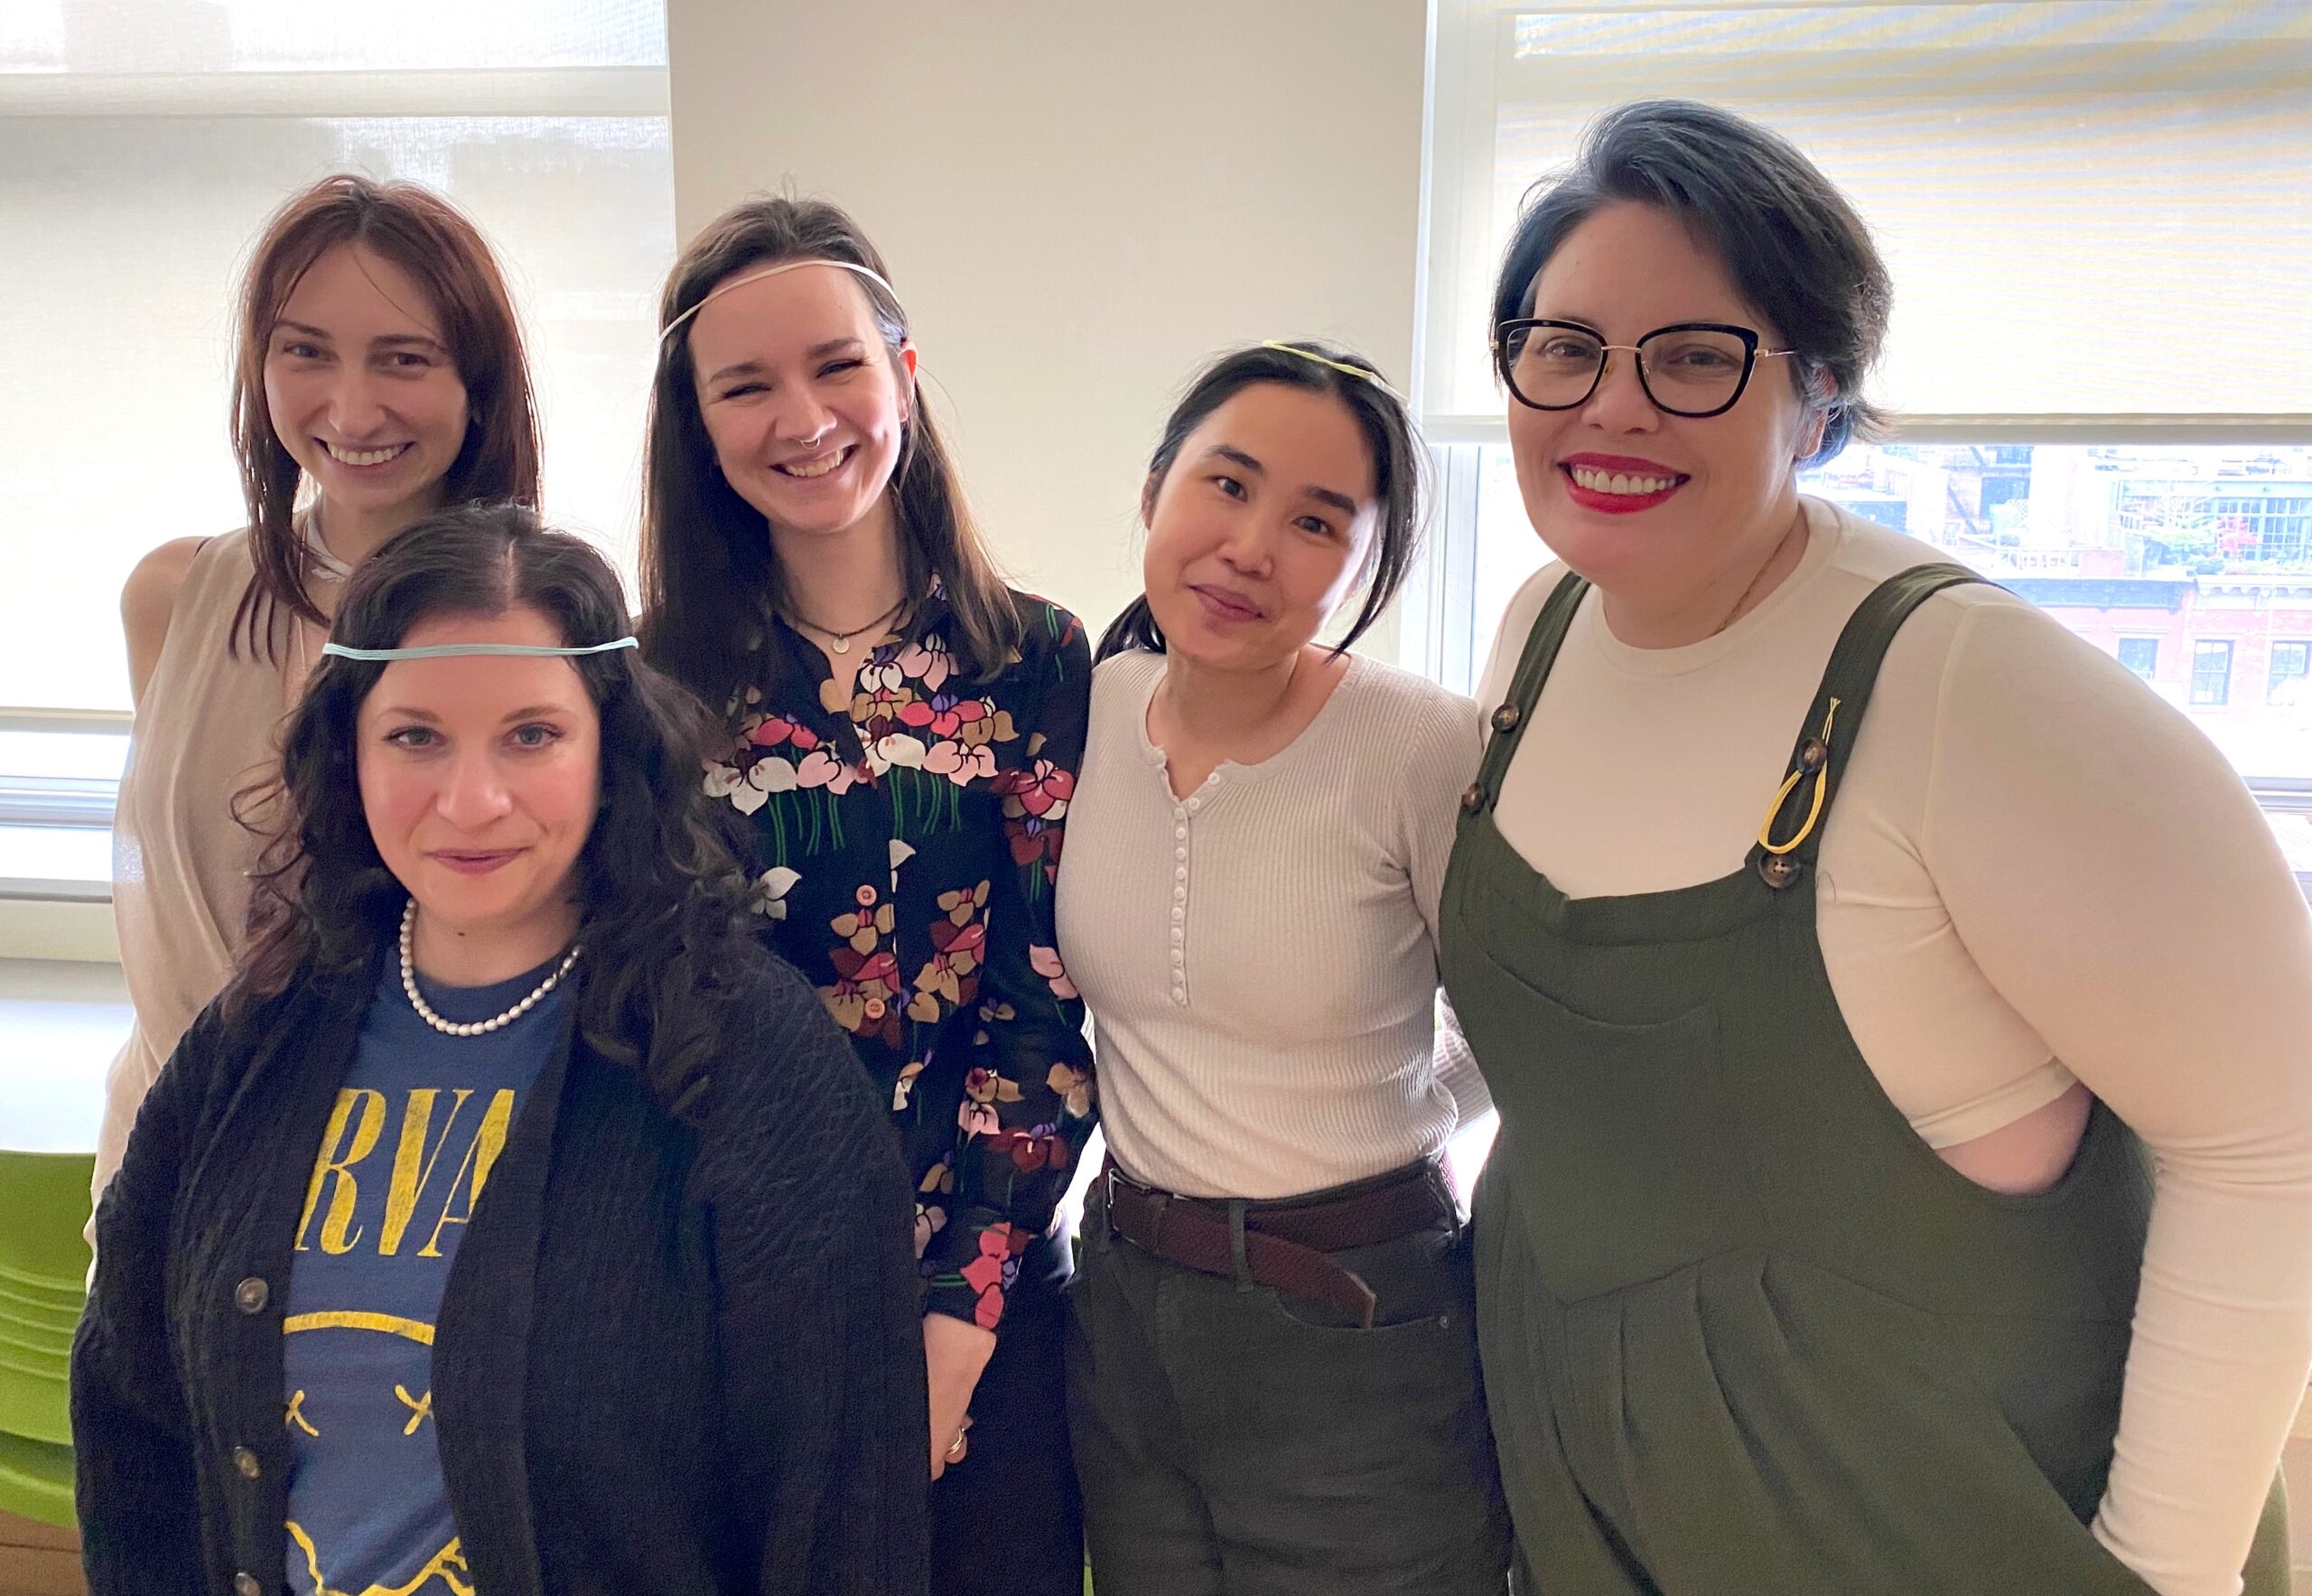
Figure 10. The participants chose how they wanted to wear their “recursive crowns” or loops that they created during the workshop. Some chose to wear around their heads, necks, and even as a loop attached to their clothing. Pictured from left to right: Scarlett Moldovan, Sara Zucker, Calista Donohoe, Kelsey Kiantoro, and Veneranda Aquirre.
- The thread should be anchored to the body in 1-2 spots on each arm (upper arm and wrist), 1-2 on each leg (thigh and calf), the waist, and the hips. Each Data Player will have, at most, 7 places of contact (not including their recursive crown).
- Note: some Data Players will not have a source part of the path and others might not have a target part of the path. This is due to the way the Python script matched the pairs of the chosen “top 8” artists within the same episode date as it was ordered in the dataset (and any subsequent sorting / filtering activities performed in the data processing steps). The weight of the connections is driving the “popularity” more than the color frequency.
- *If there are less than 8 Data Players: During the trial run of the workshop, we ran into this situation. We utilized elements in the classroom, like chairs, a mic stand, and a structural pole as stand-ins for the missing Data Players. We later had more participants arrive, so we cut away the thread wrapped around those elements and rewrapped around the human Data Player.
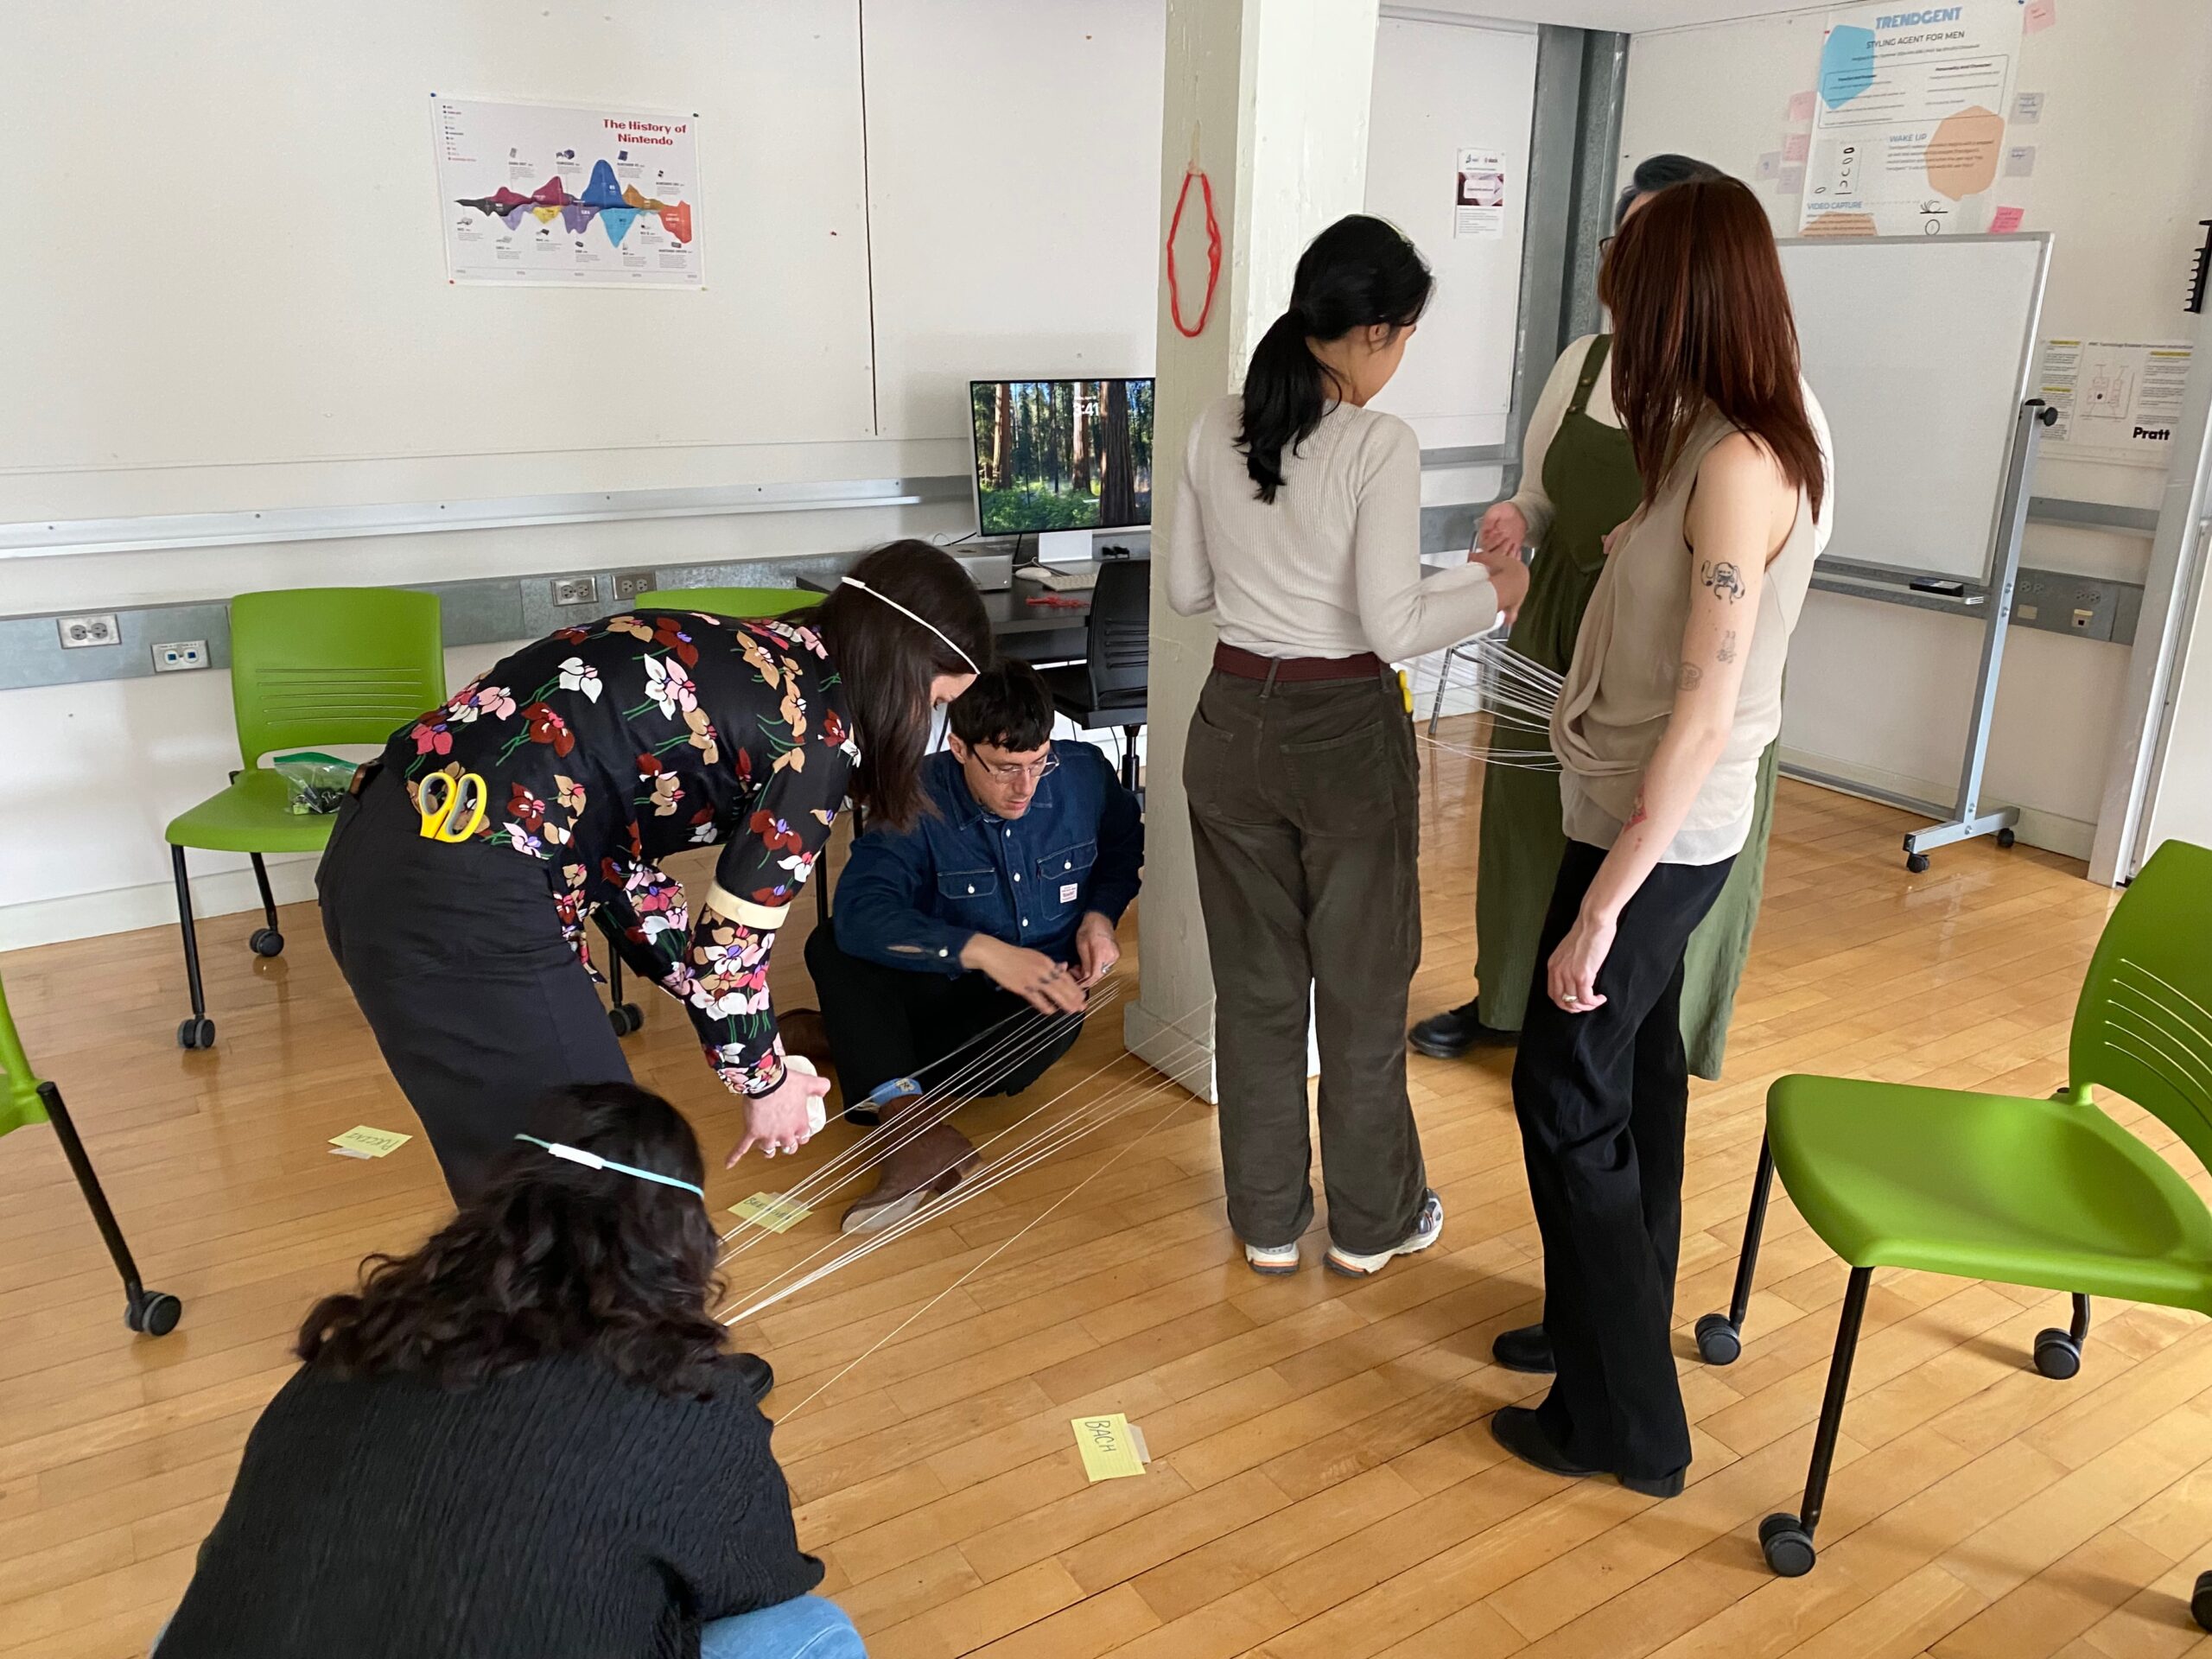
Figure 11. *Since we didn’t have enough “Data Players” and “Data Makers” at the start of the workshop trial, we used an existing pillar in the classroom to serve as one of our “nodes”. We all worked together to wrap the thread around our “Data Player” nodes.
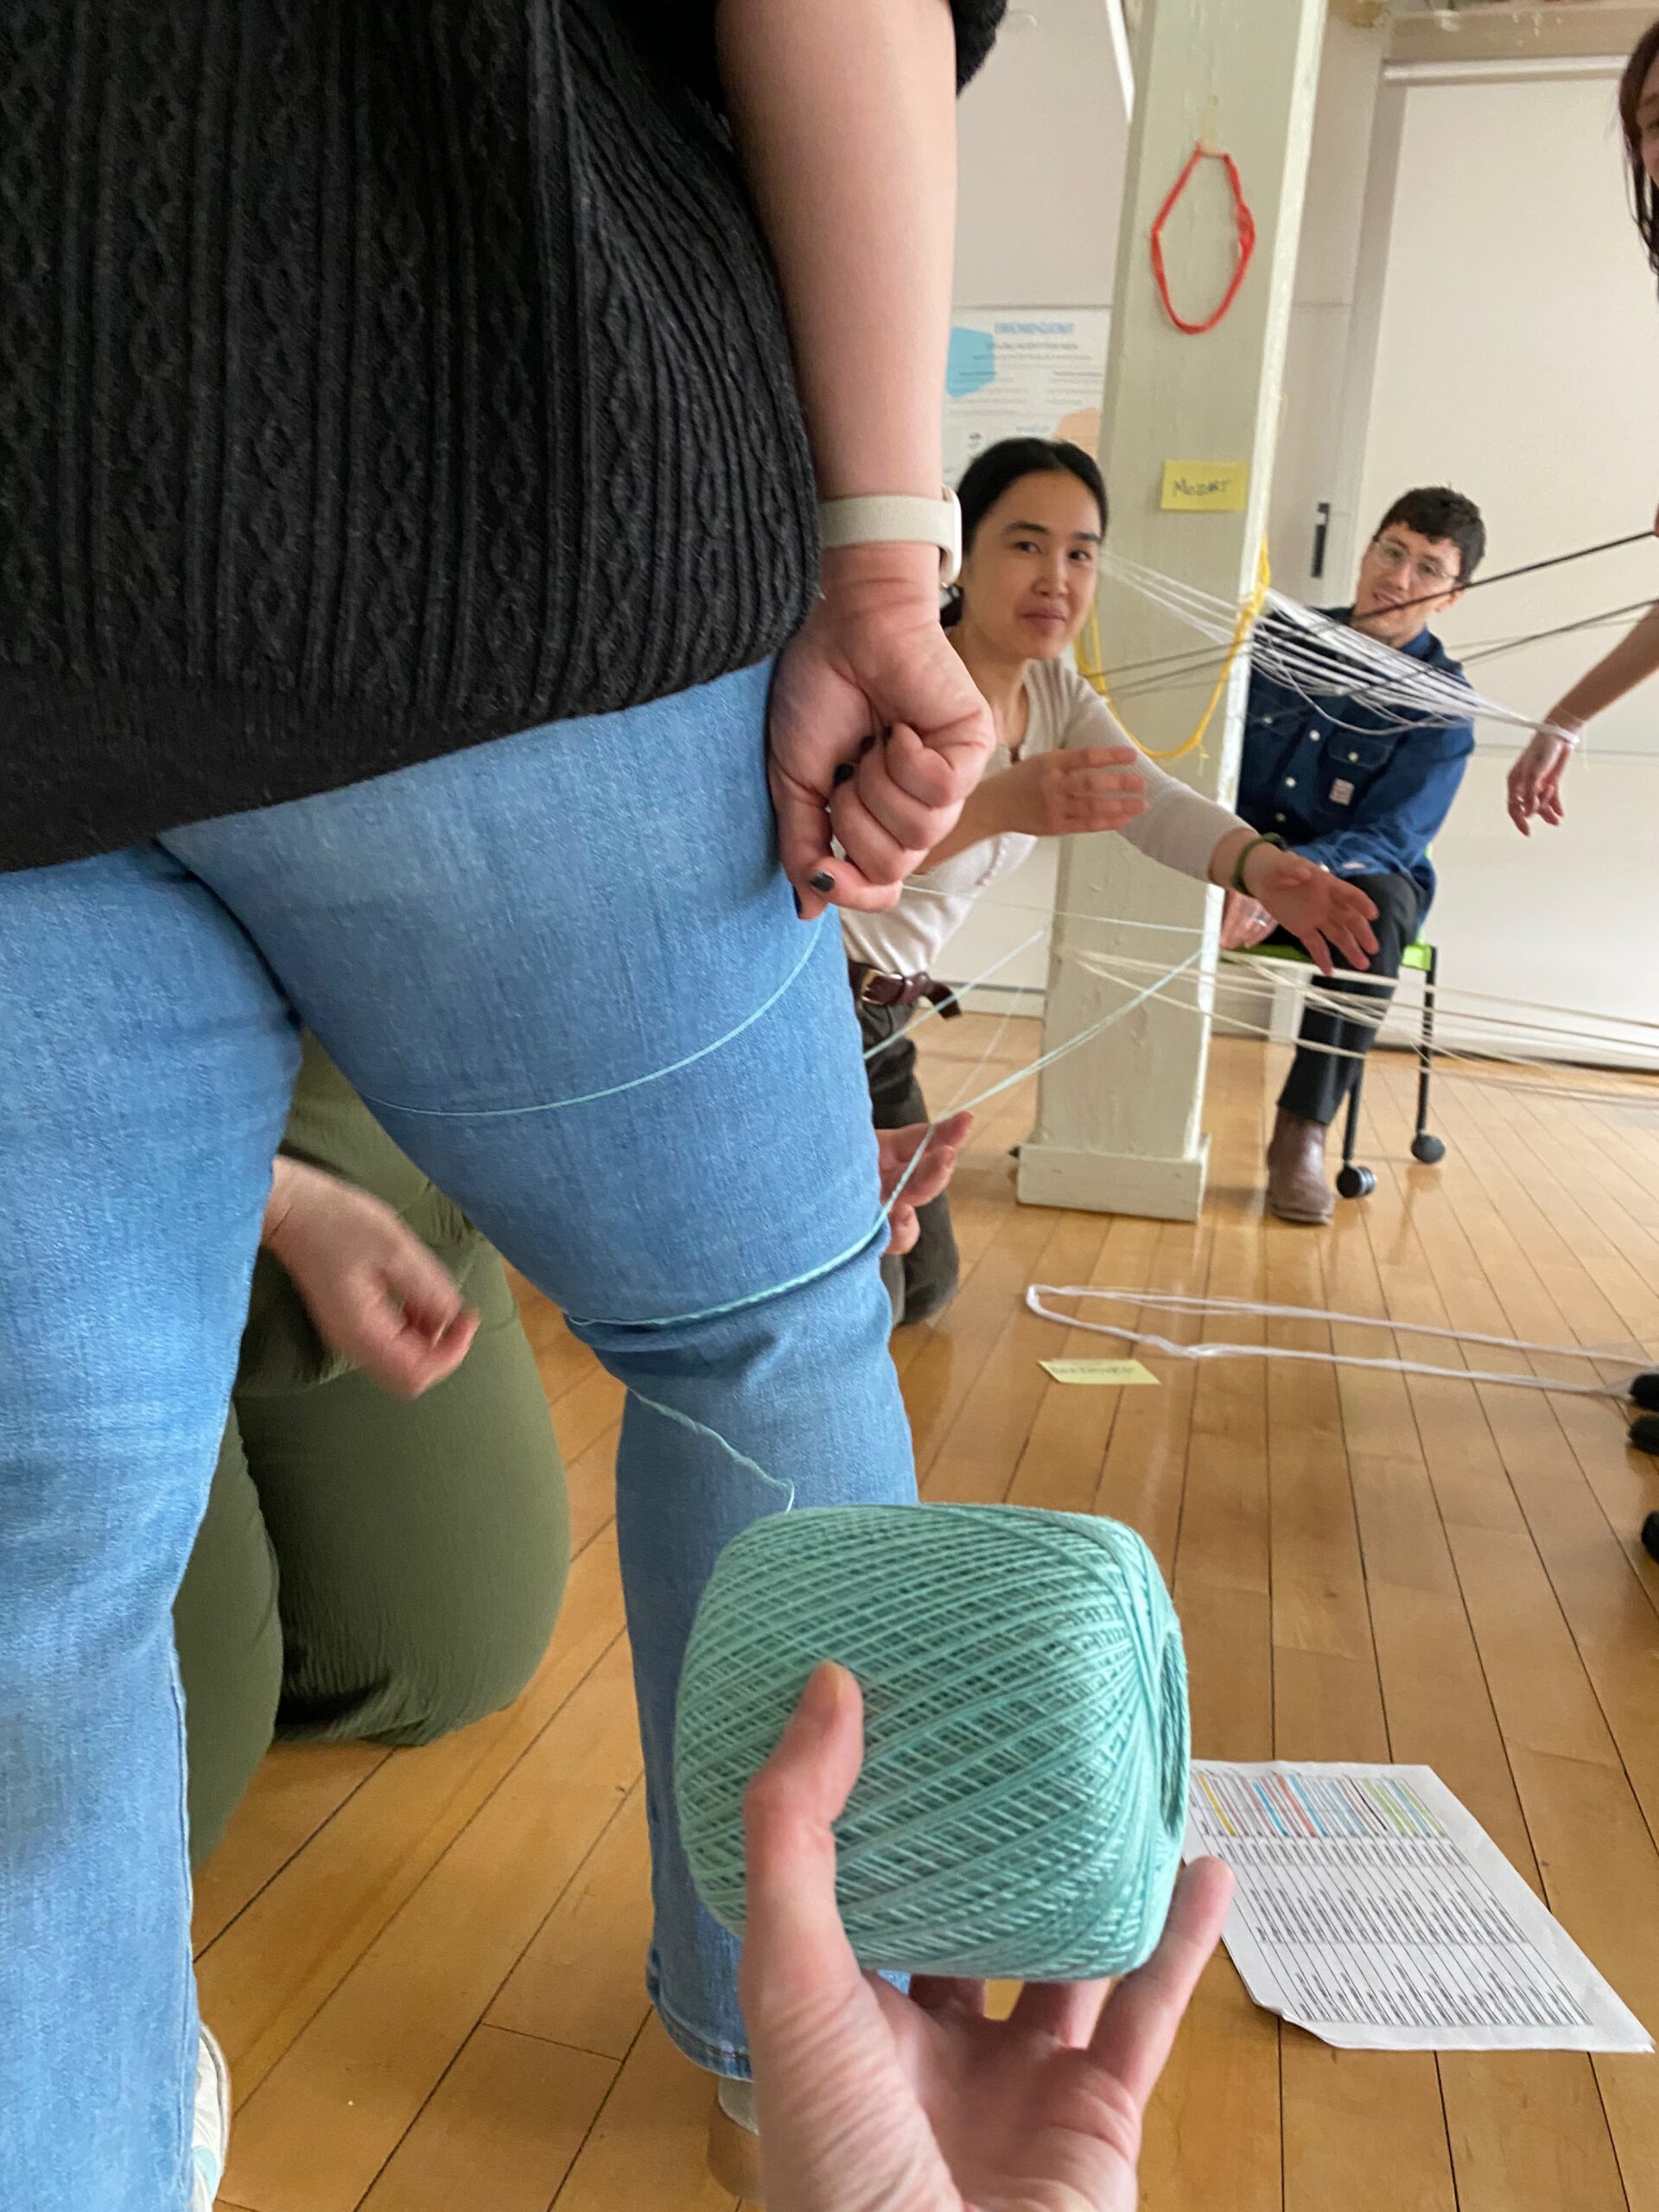
Figure 12. *This is the pillar (playing the role of “Data Player” representing the node of Mozart).
- **If there are less than 2 Data Makers: Similar to being short on Data Players, we only had one participant that could play the dedicated role of the Data Maker. In this case, each participant played both parts (until they were too limited in their motility from being connected with thread in multiple anchor points of the body to others).
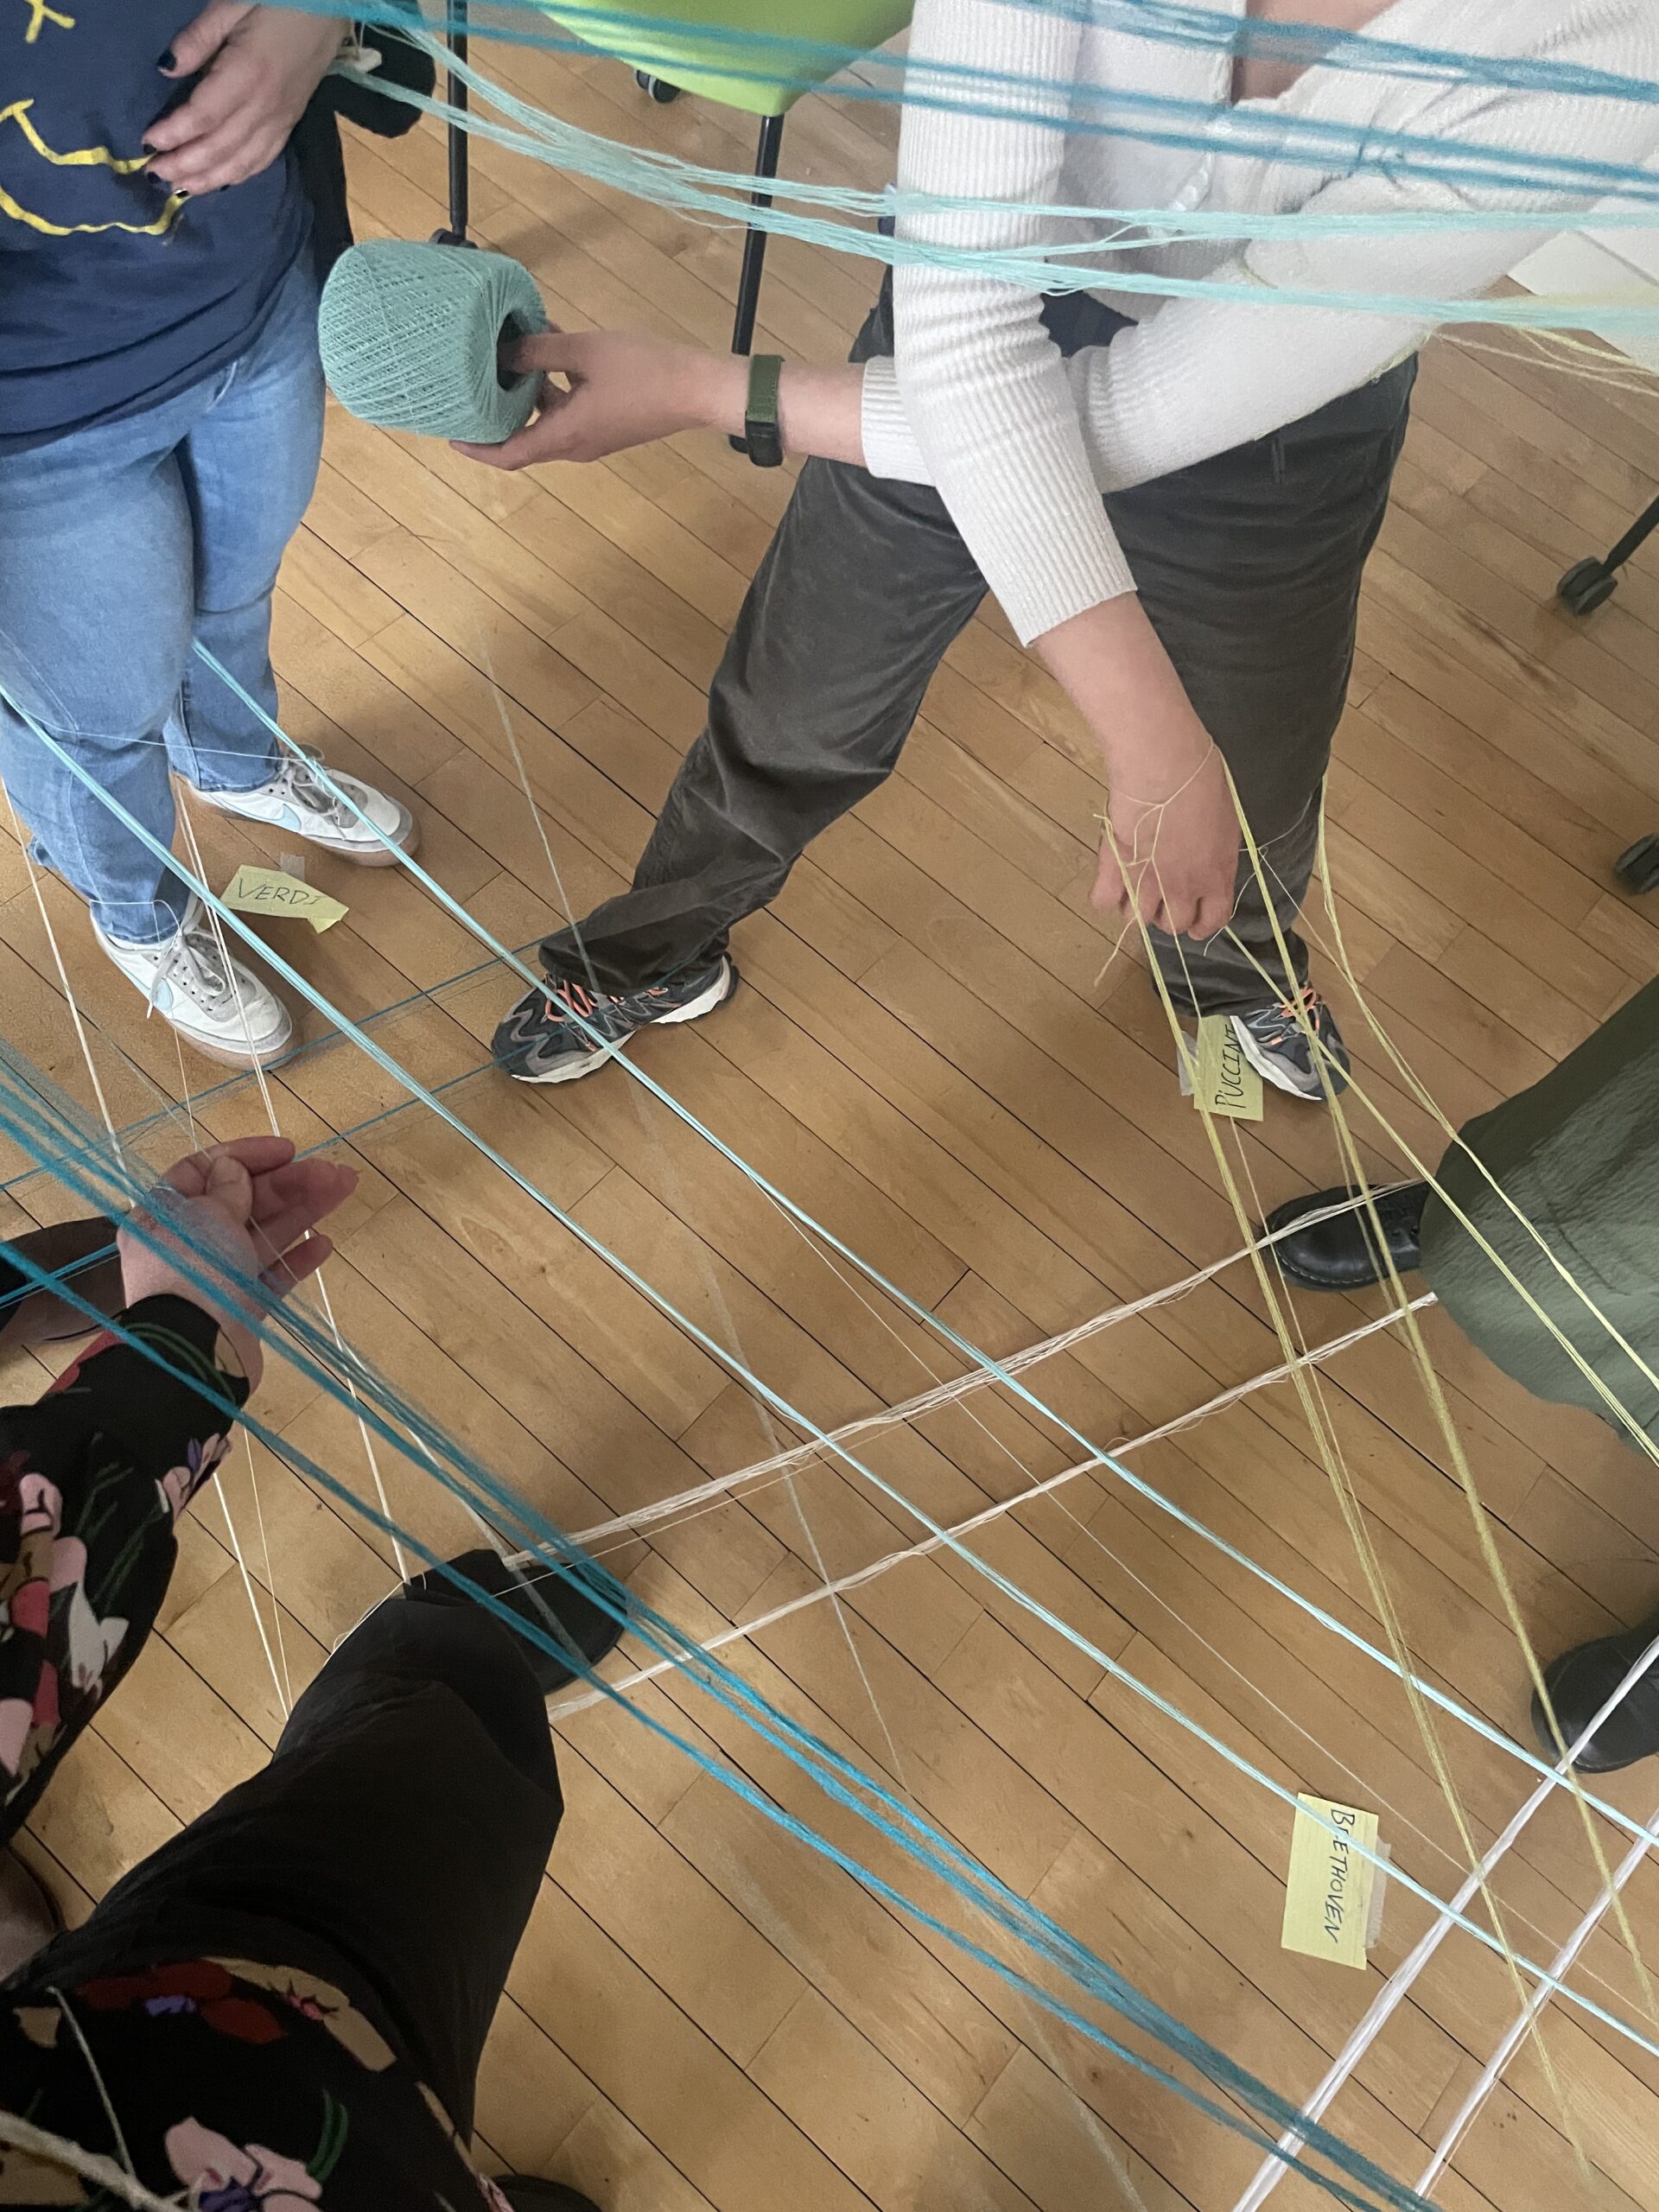
Figure 13. **A “Data Player” passes the thread to one of the other “Data Players” to assist the singular “Data Maker” in the wrapping of the thread. Photograph taken by Calista Donohoe, 2025.
- The Data Makers will continue the process of first securing, wrapping, and then tying off the thread for each of the line items in the node and edges table. It is recommended to symmetrically match the place on the body for any particular source-target pathway. For example, if the Data Maker starts on the right wrist of the source node Data Player and they are facing the target node Data Player, the Data Maker should attach to the target node Data Player’s left wrist. In other words, crossing the axis of the body should be avoided when connecting a related source-target pair.
- Don’t forget to check in with the participants to see if they need to take a break, sit down, or even change roles. Changing roles mid-way, involves removing the attached thread from one participant to the other.
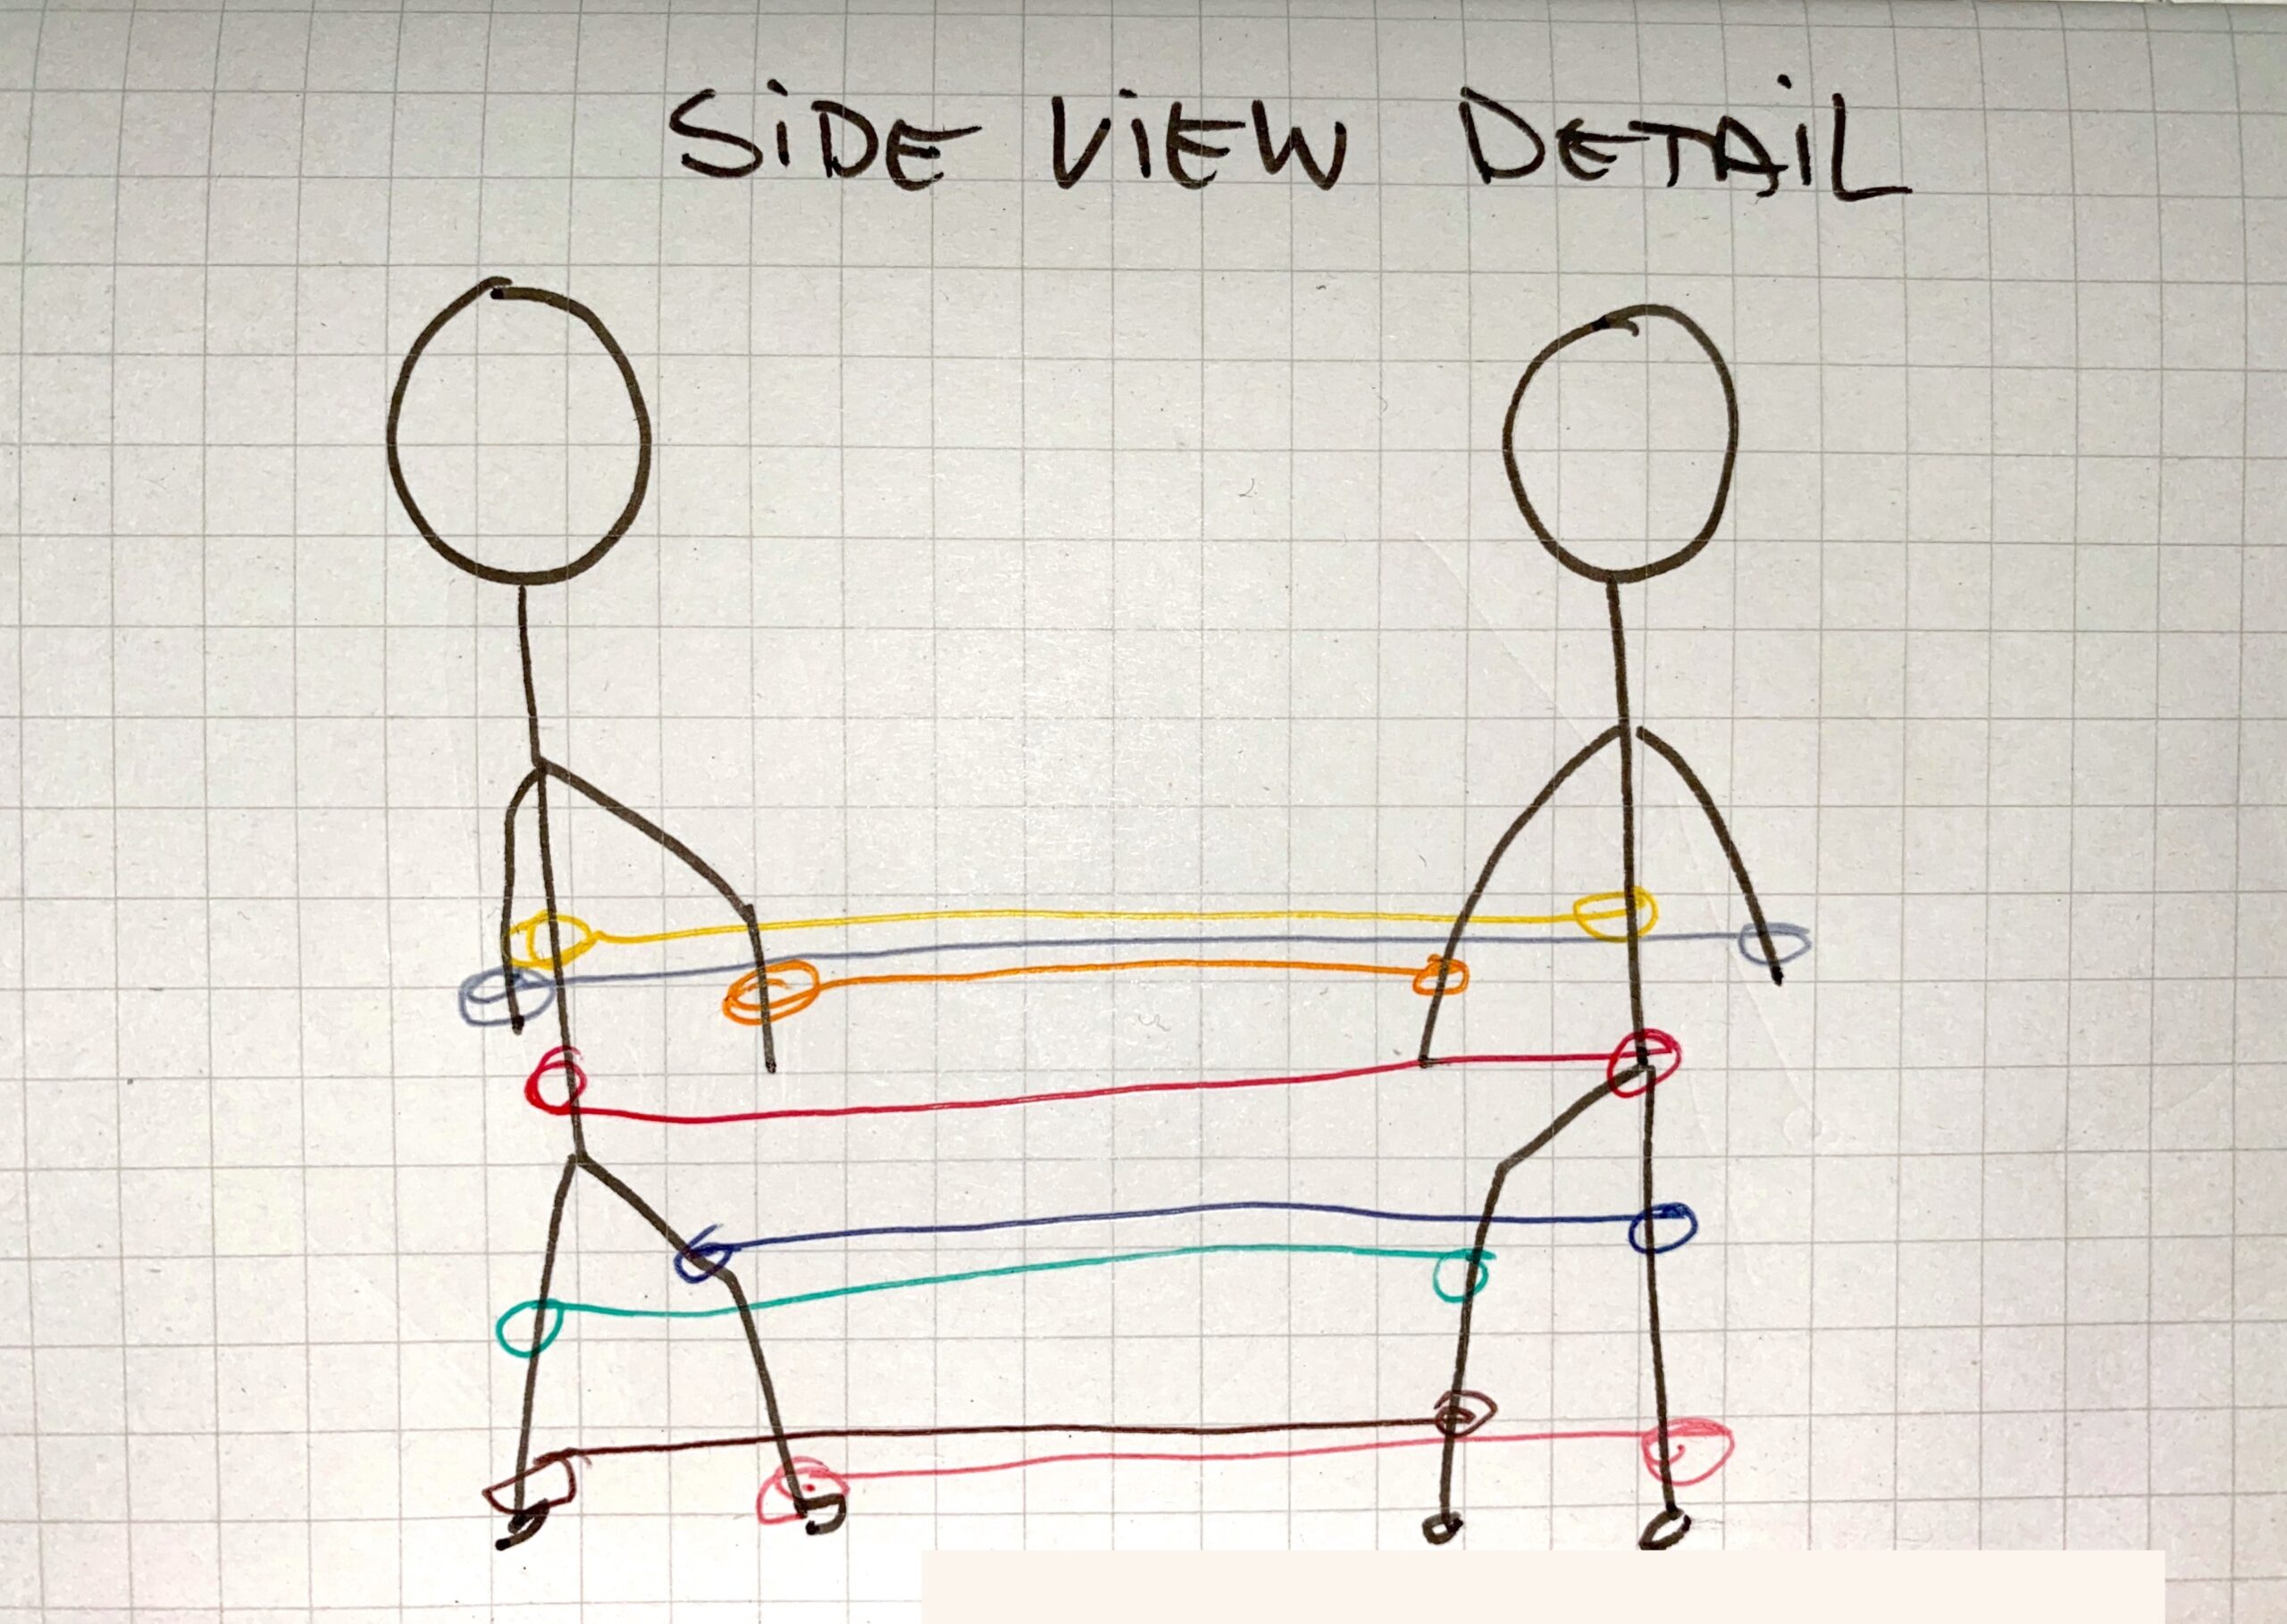
Figure 14. Preliminary sketch depicting plan to connect the participants to each other by wrapping crochet thread from different points of one participant’s body to another participant’s body.
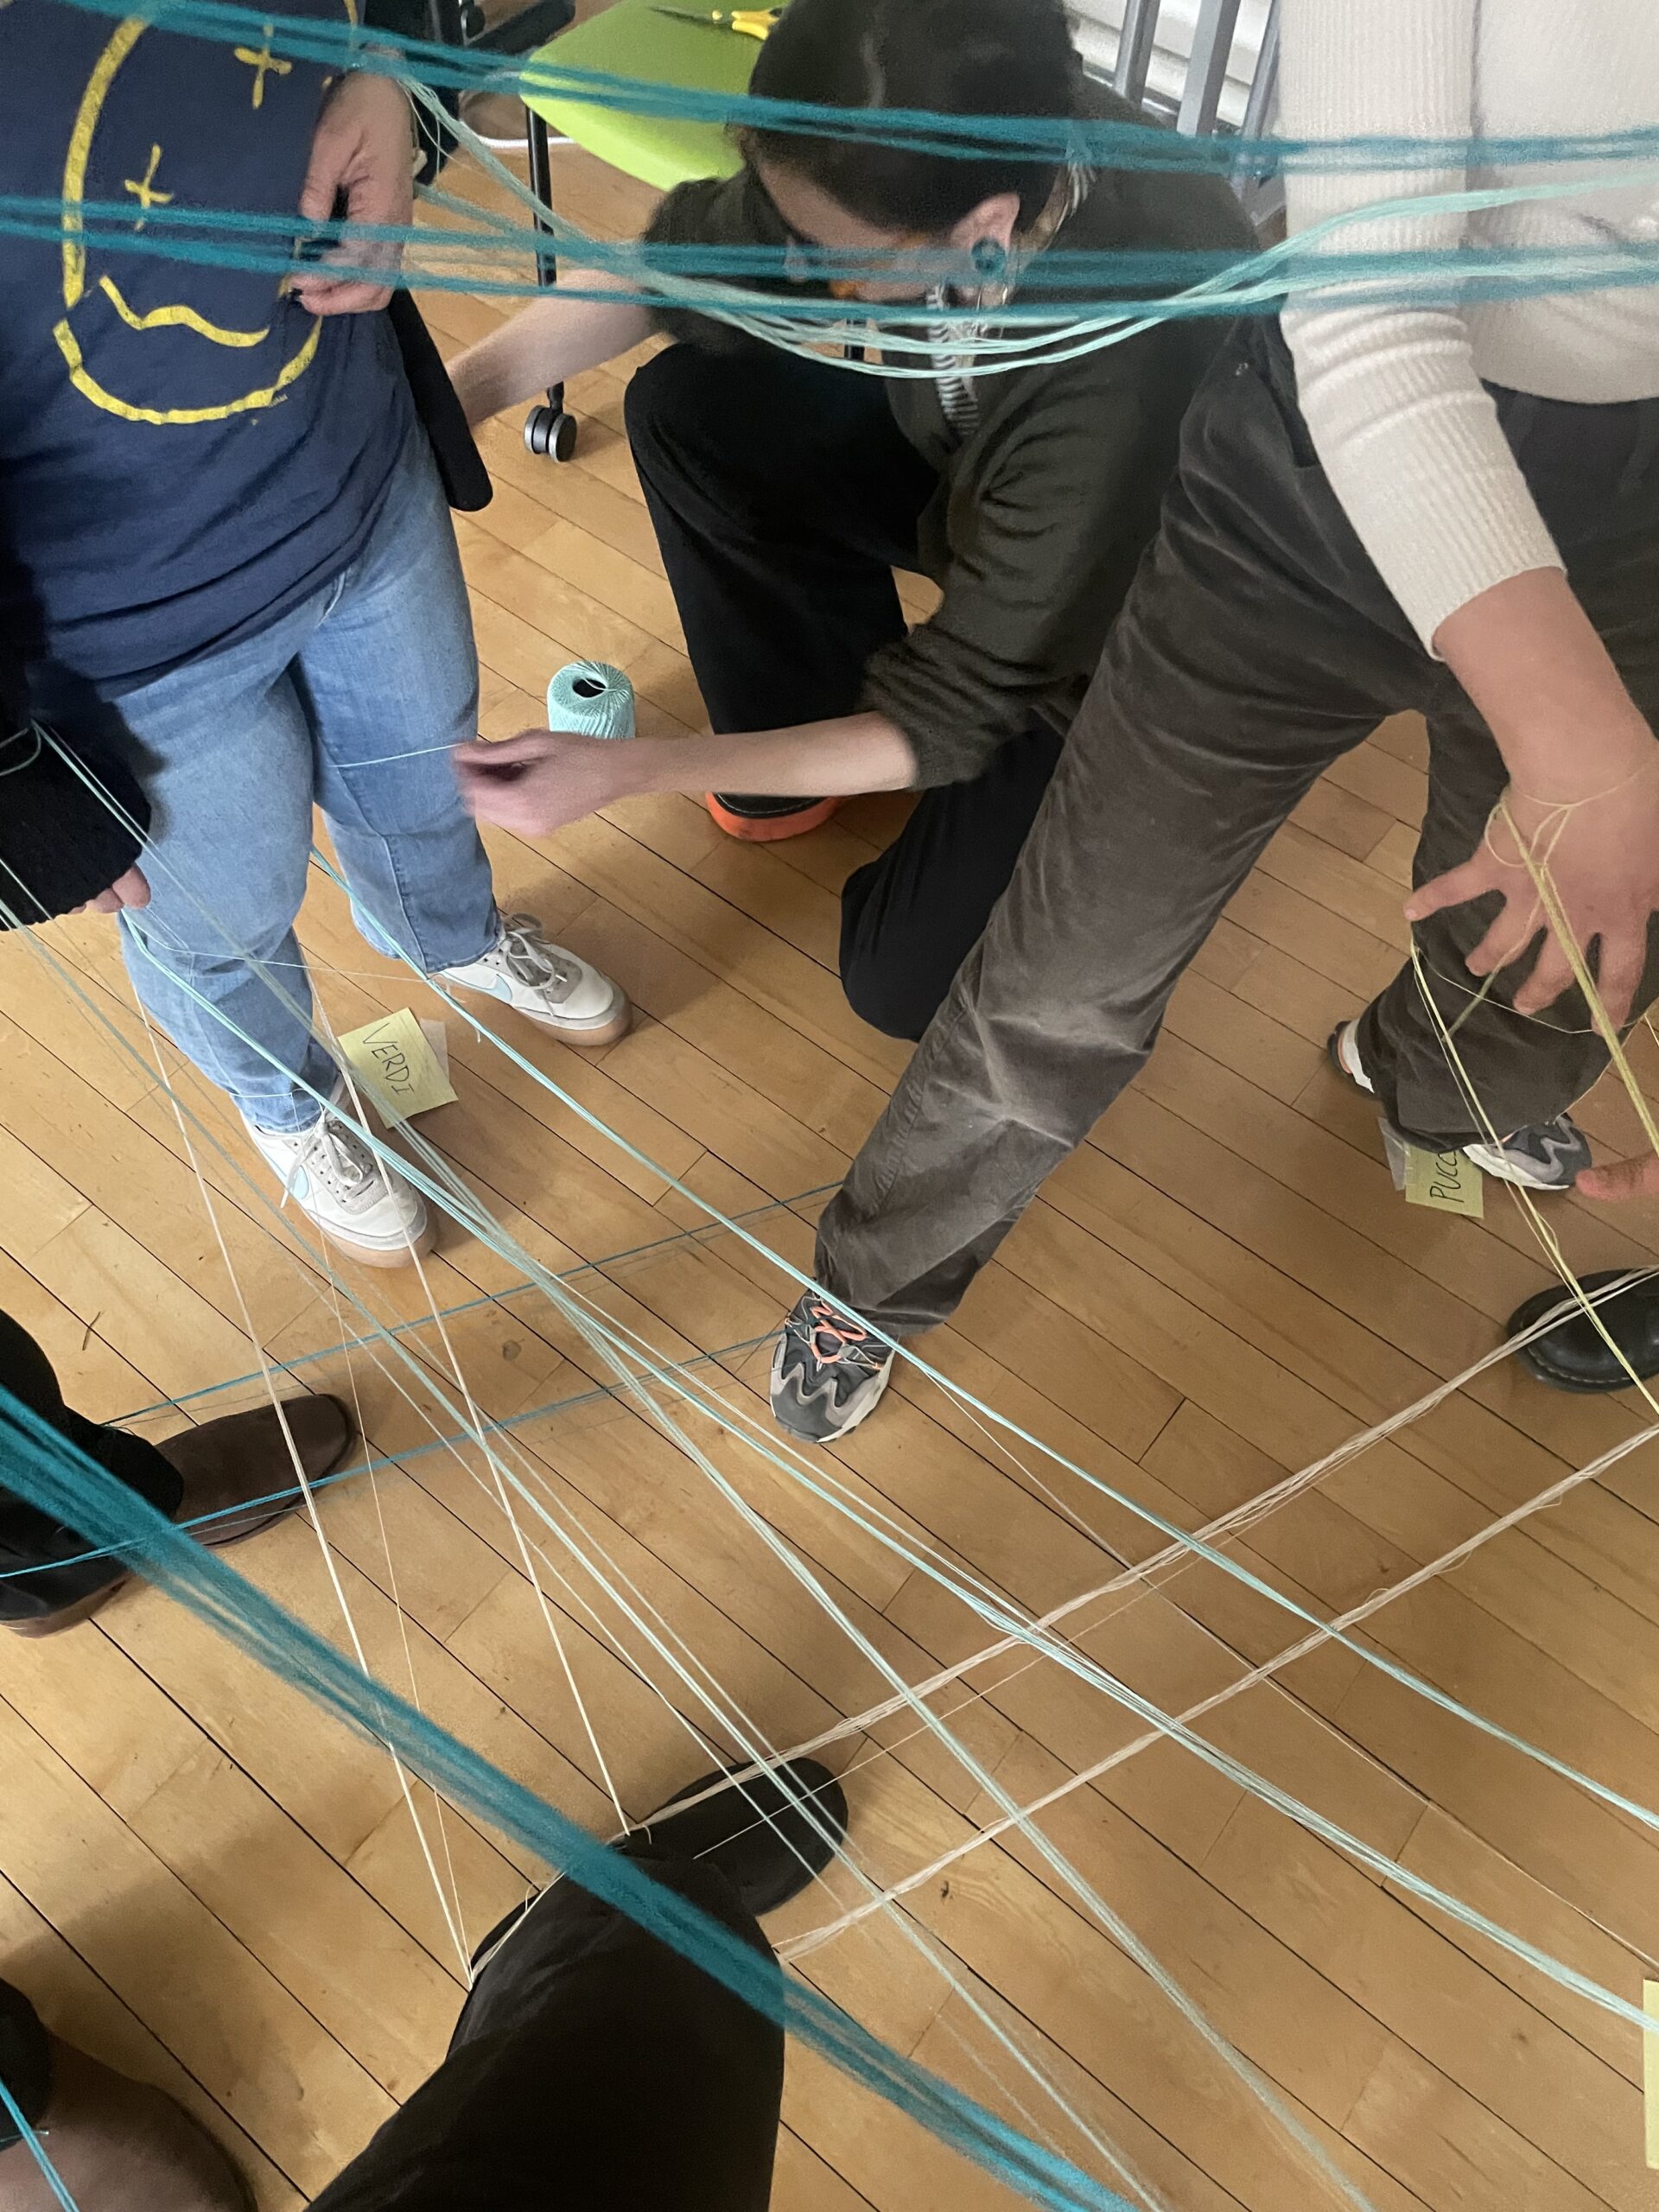
Figure 15. A “Data Maker” ties the thread at one of the anchor points, the upper thigh, of a “Data Player”. Photograph taken by Calista Donohoe, 2025.
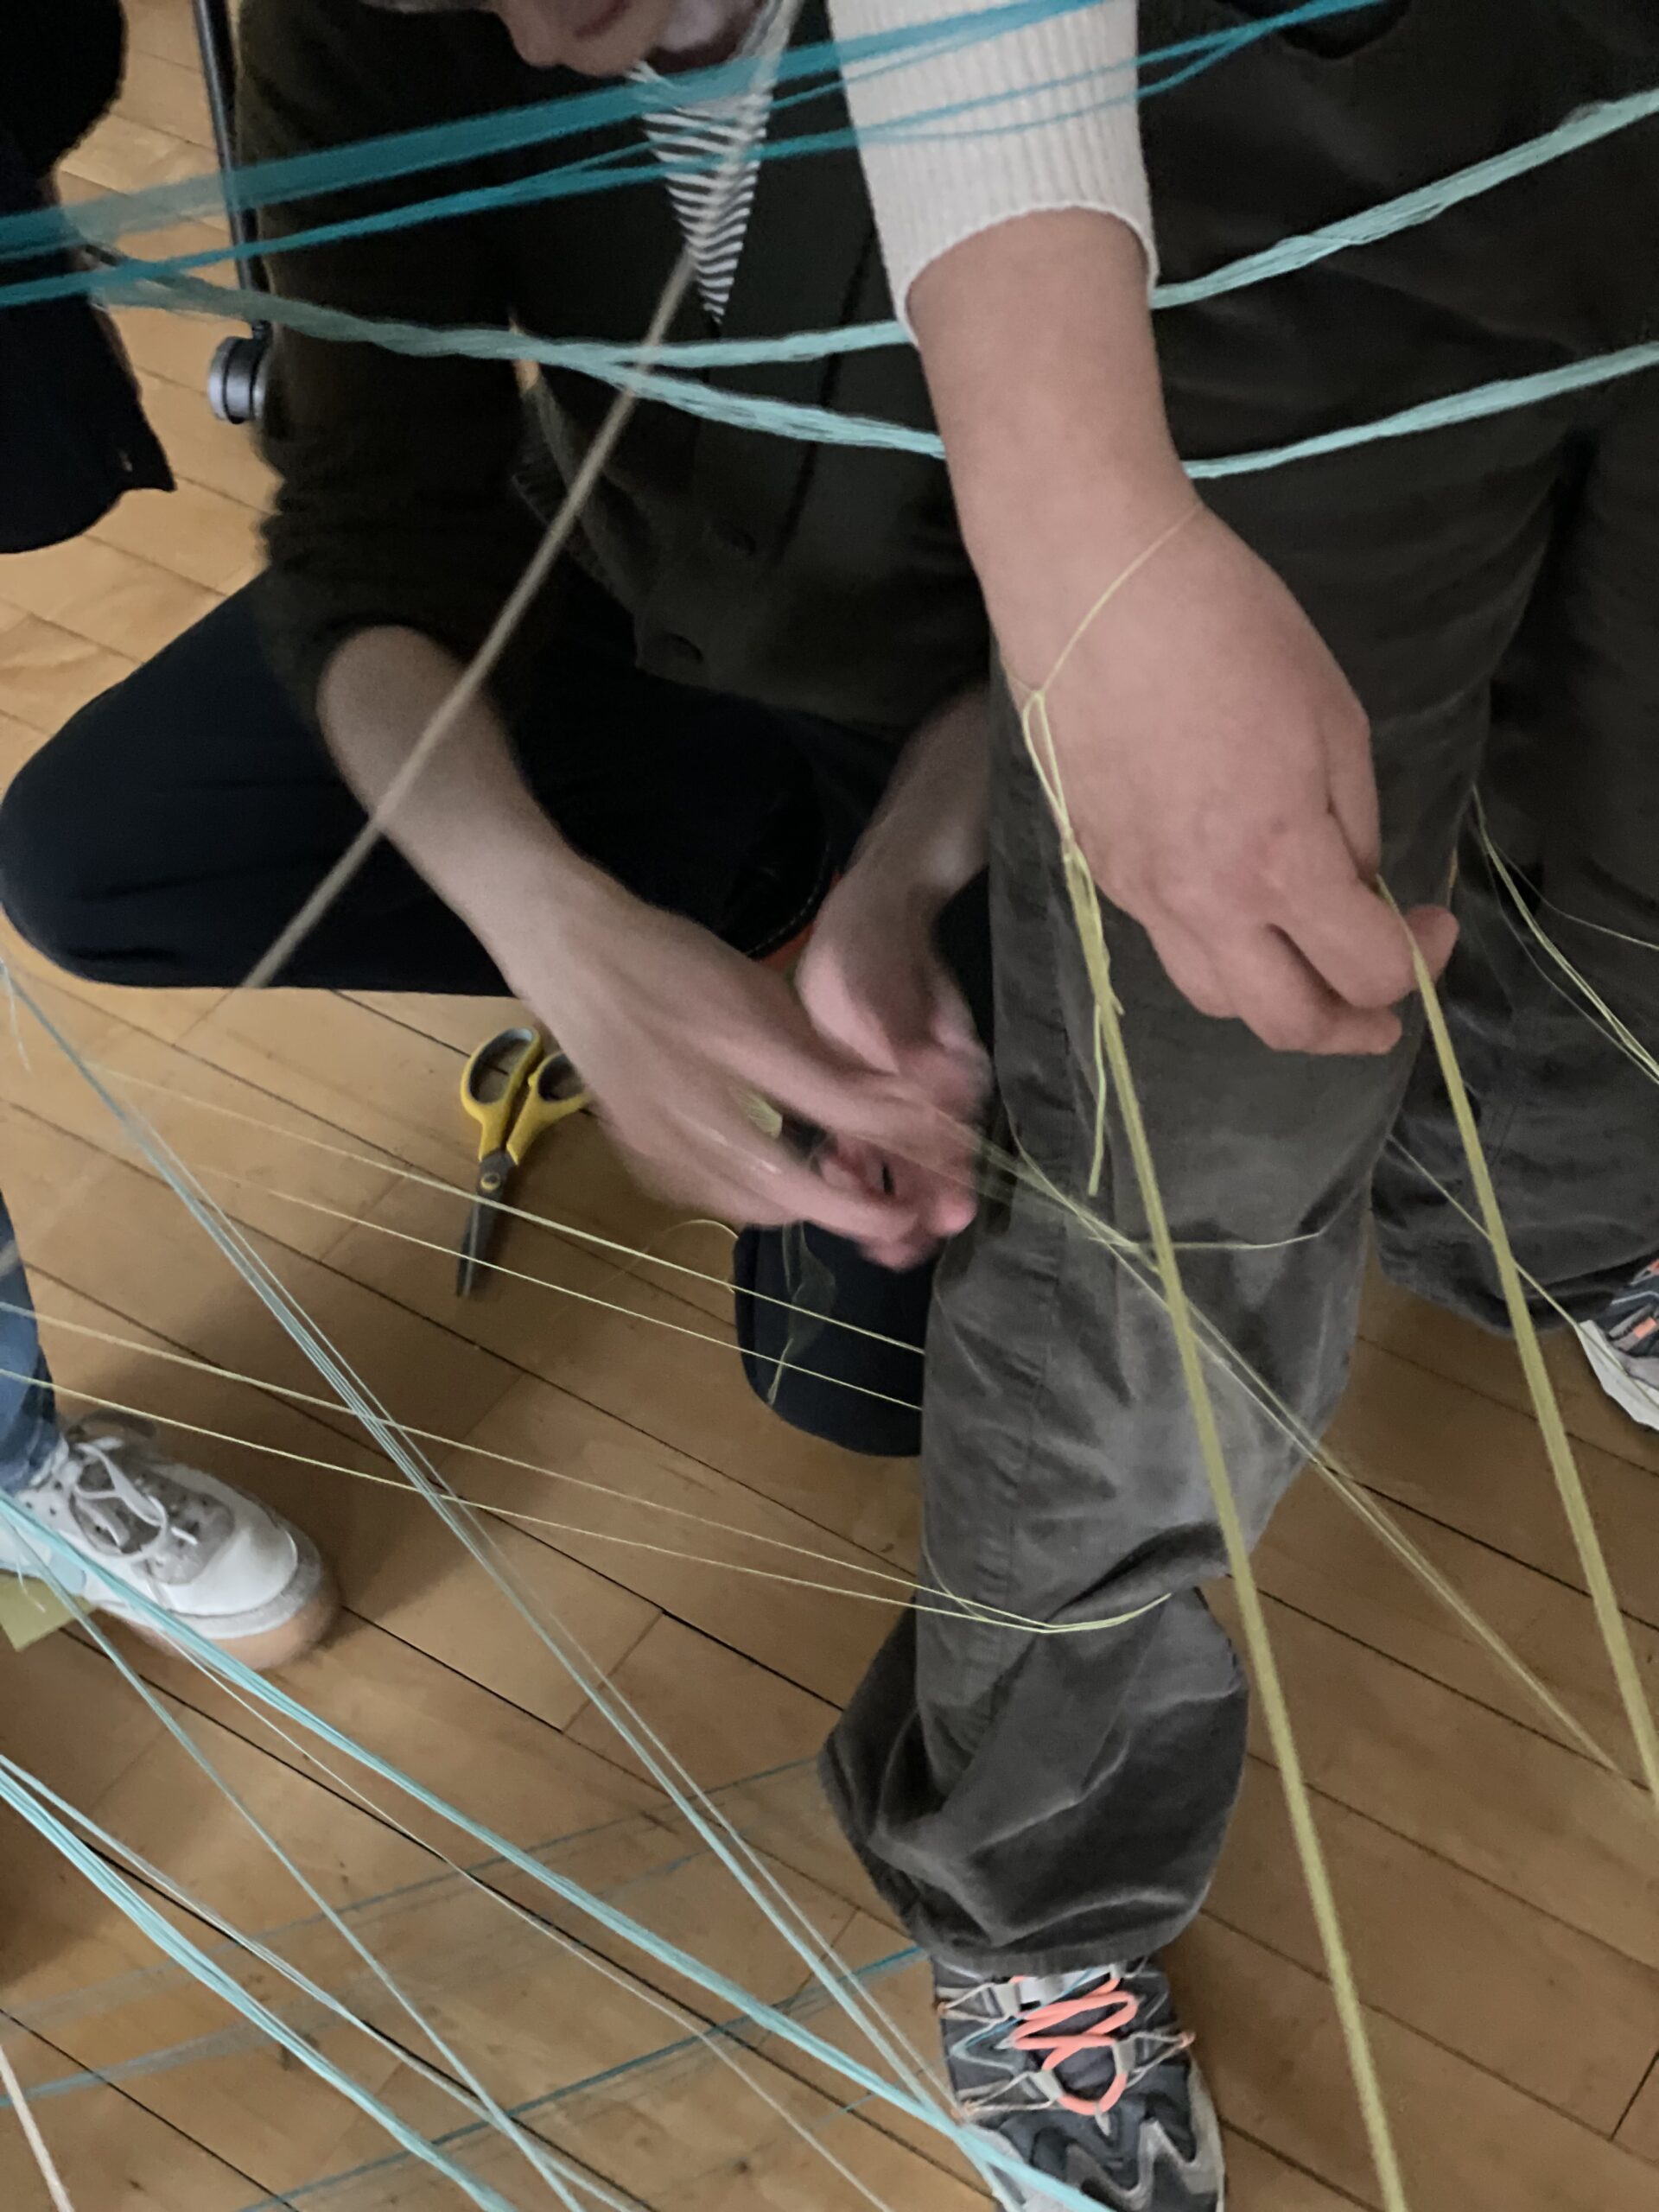
Figure 16. Close up view of a “Data Maker” tying the thread at one of the anchor points, right above the knee, of a “Data Player”. Photograph taken by Calista Donohoe, 2025.
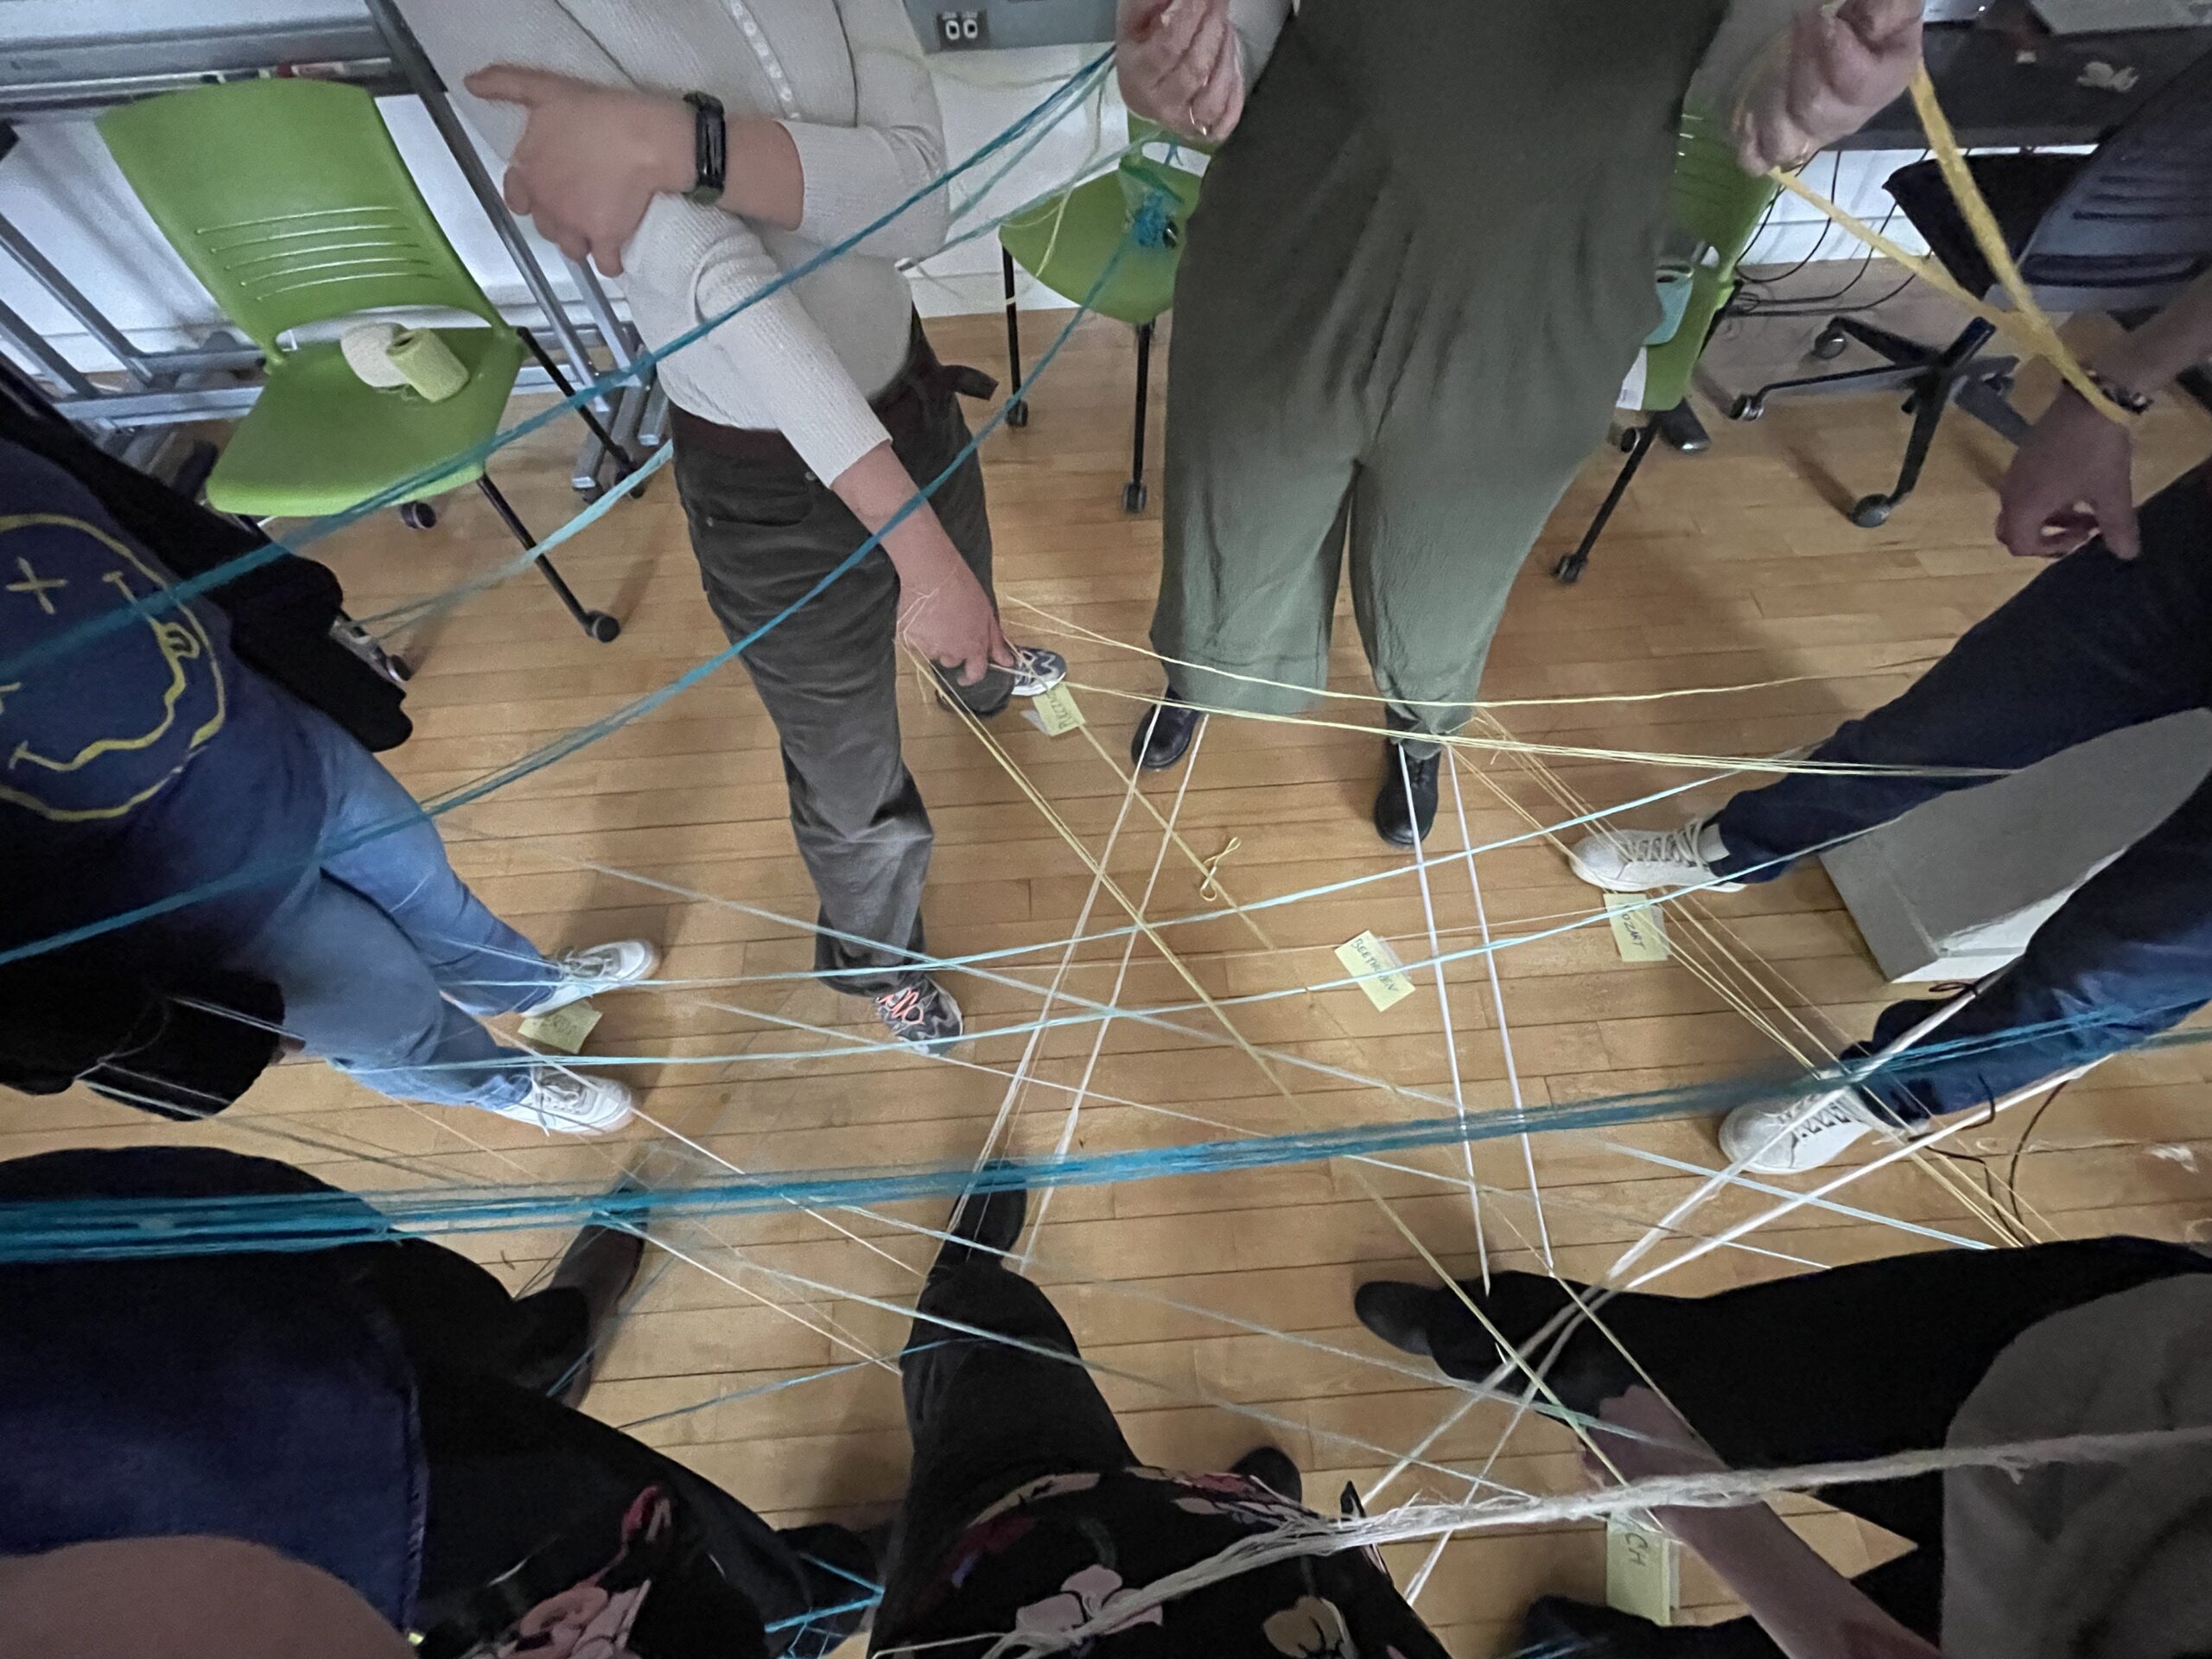
Figure 17. “Data Players” stand in formation with thread connected at the key anchor points. Photograph taken by Calista Donohoe, 2025.
Figure 18. A 360 view of the “Data Players” in the final human network graph formation. Since we only had 8 total participants for the trial run, I filled the “Data Maker” role. To hold my place in the final formation, we used a mic stand to connect the threads. After the video was taken, I slipped into the loops that were around the mic stand, completing the human network graph.
- The “Data Makers” will then distribute the absence on the floor surrounding each of the “Data Players” and in the center.
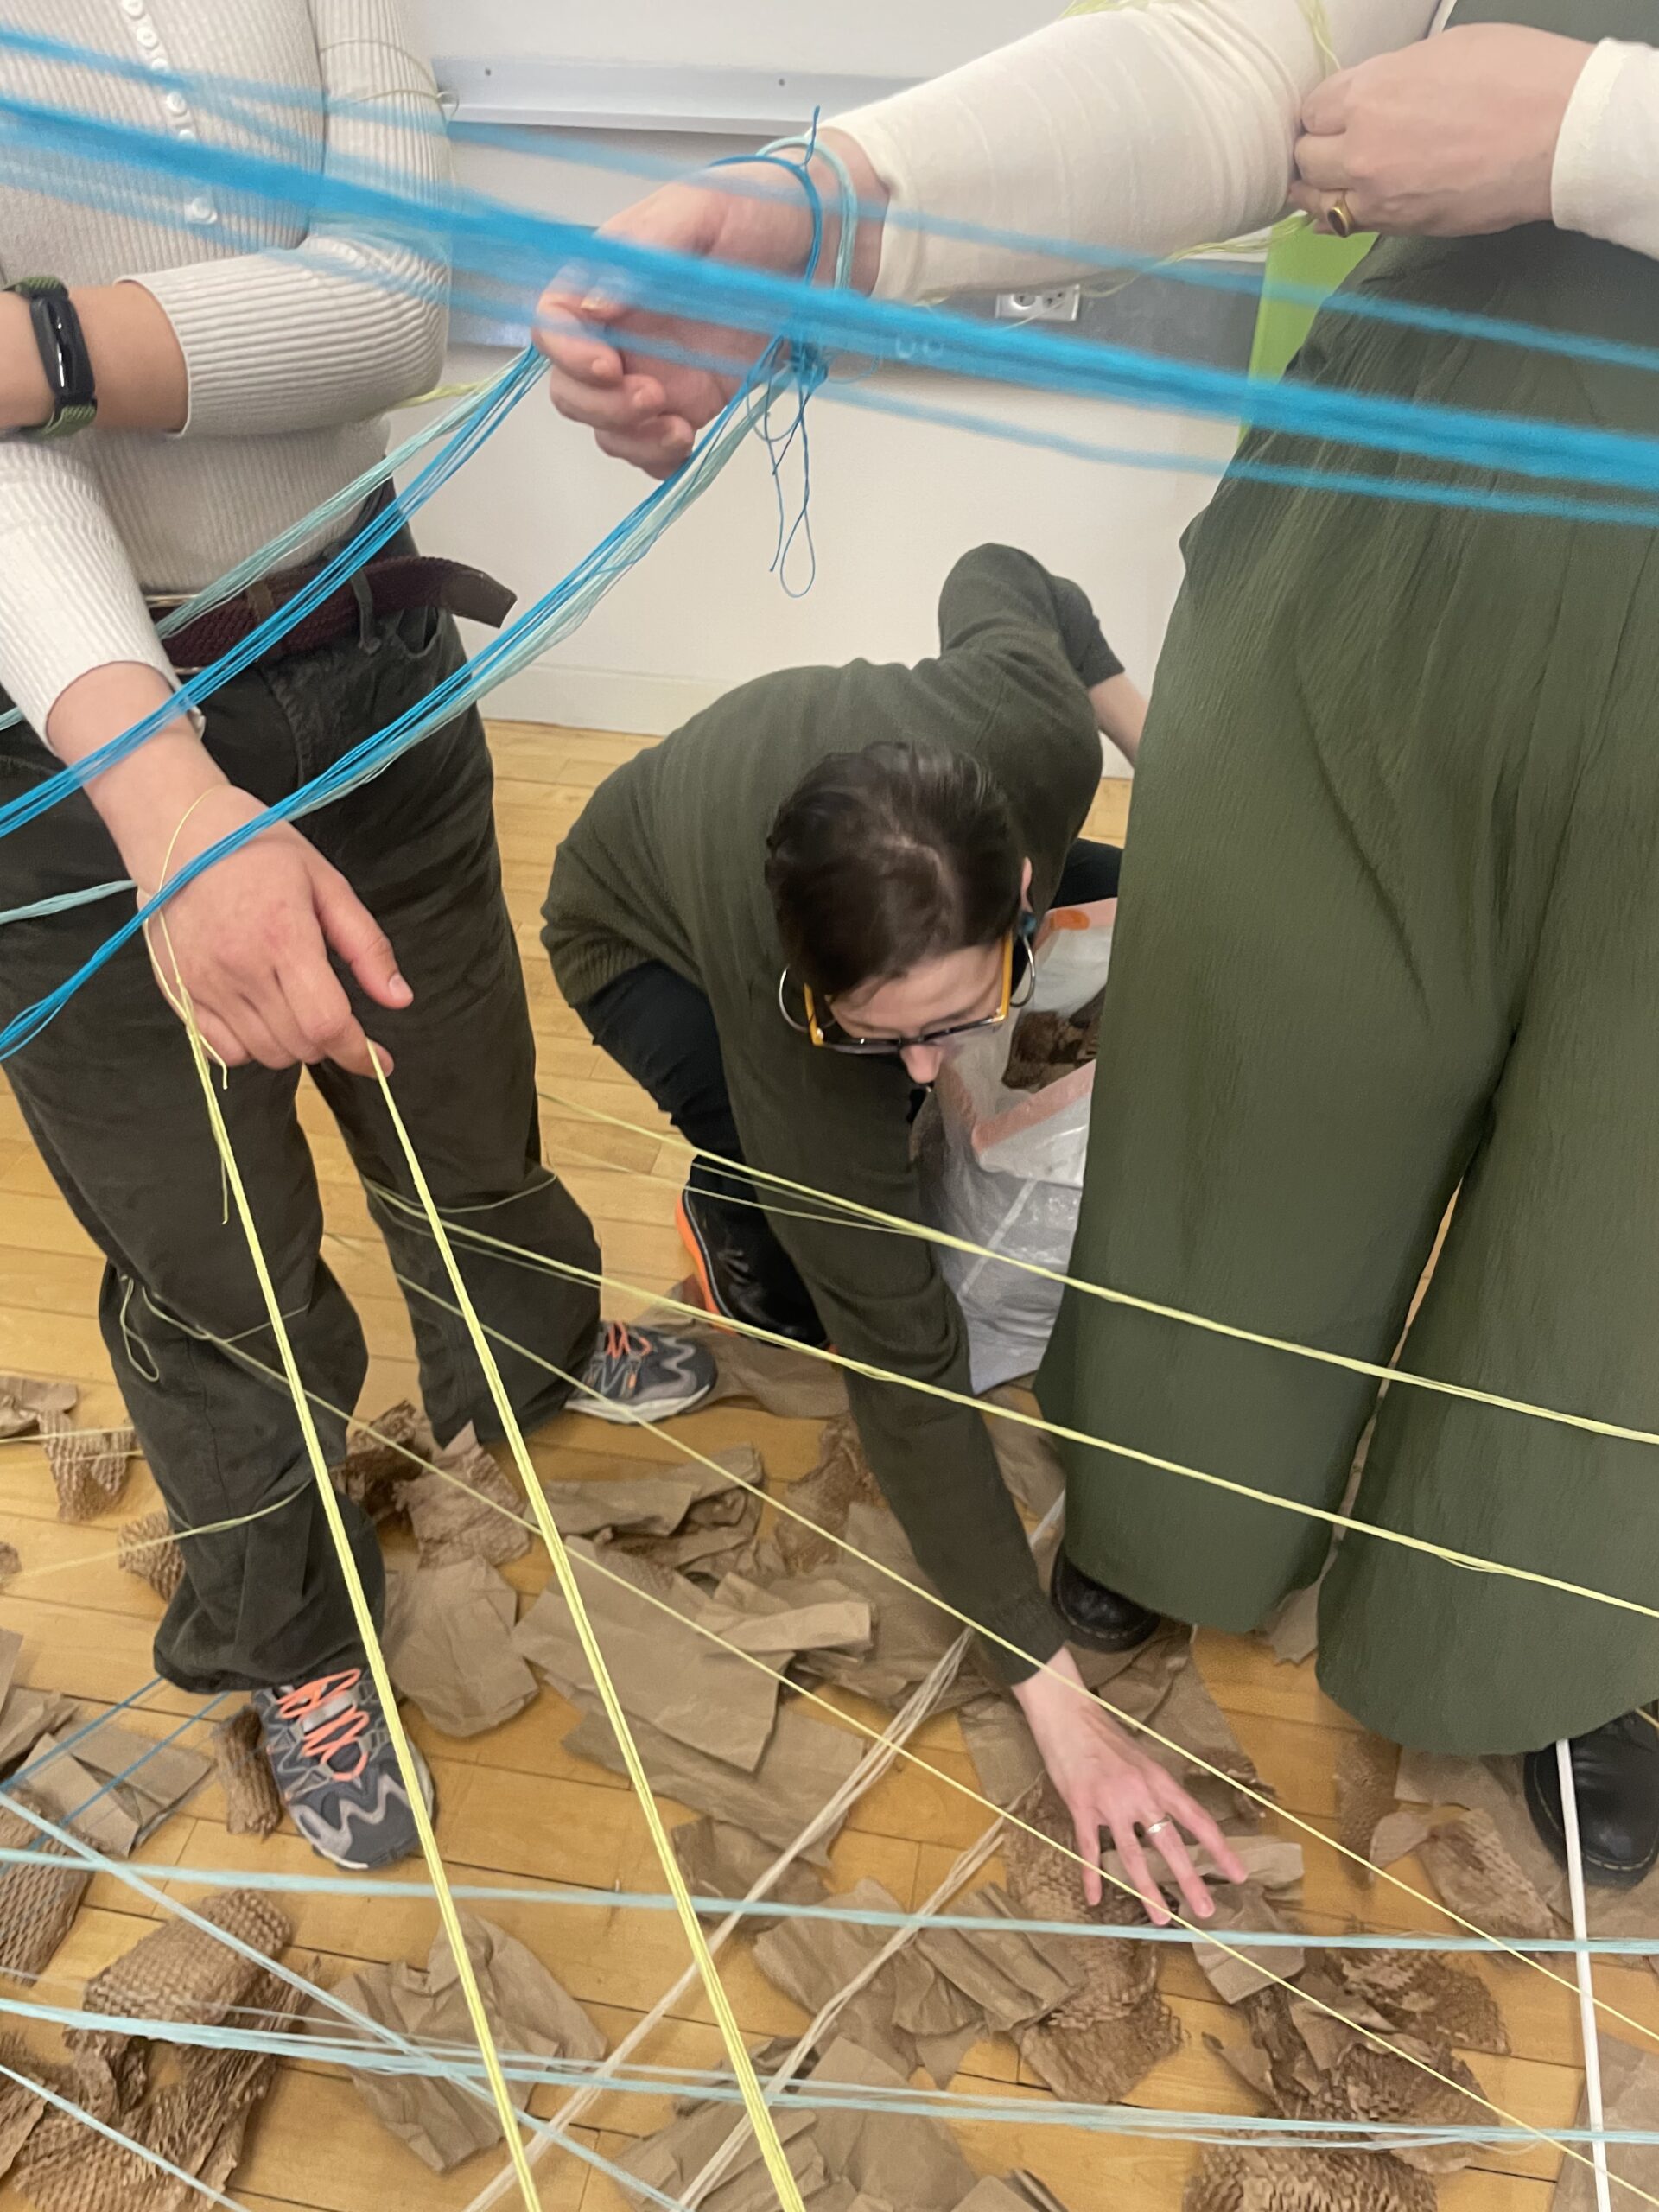
Figure 19. A “Data Maker” distributes the “absence” – paper packing material – in the center and at the feet of the “Data Players” in the human network graph formation. Photograph taken by Calista Donohoe, 2025.
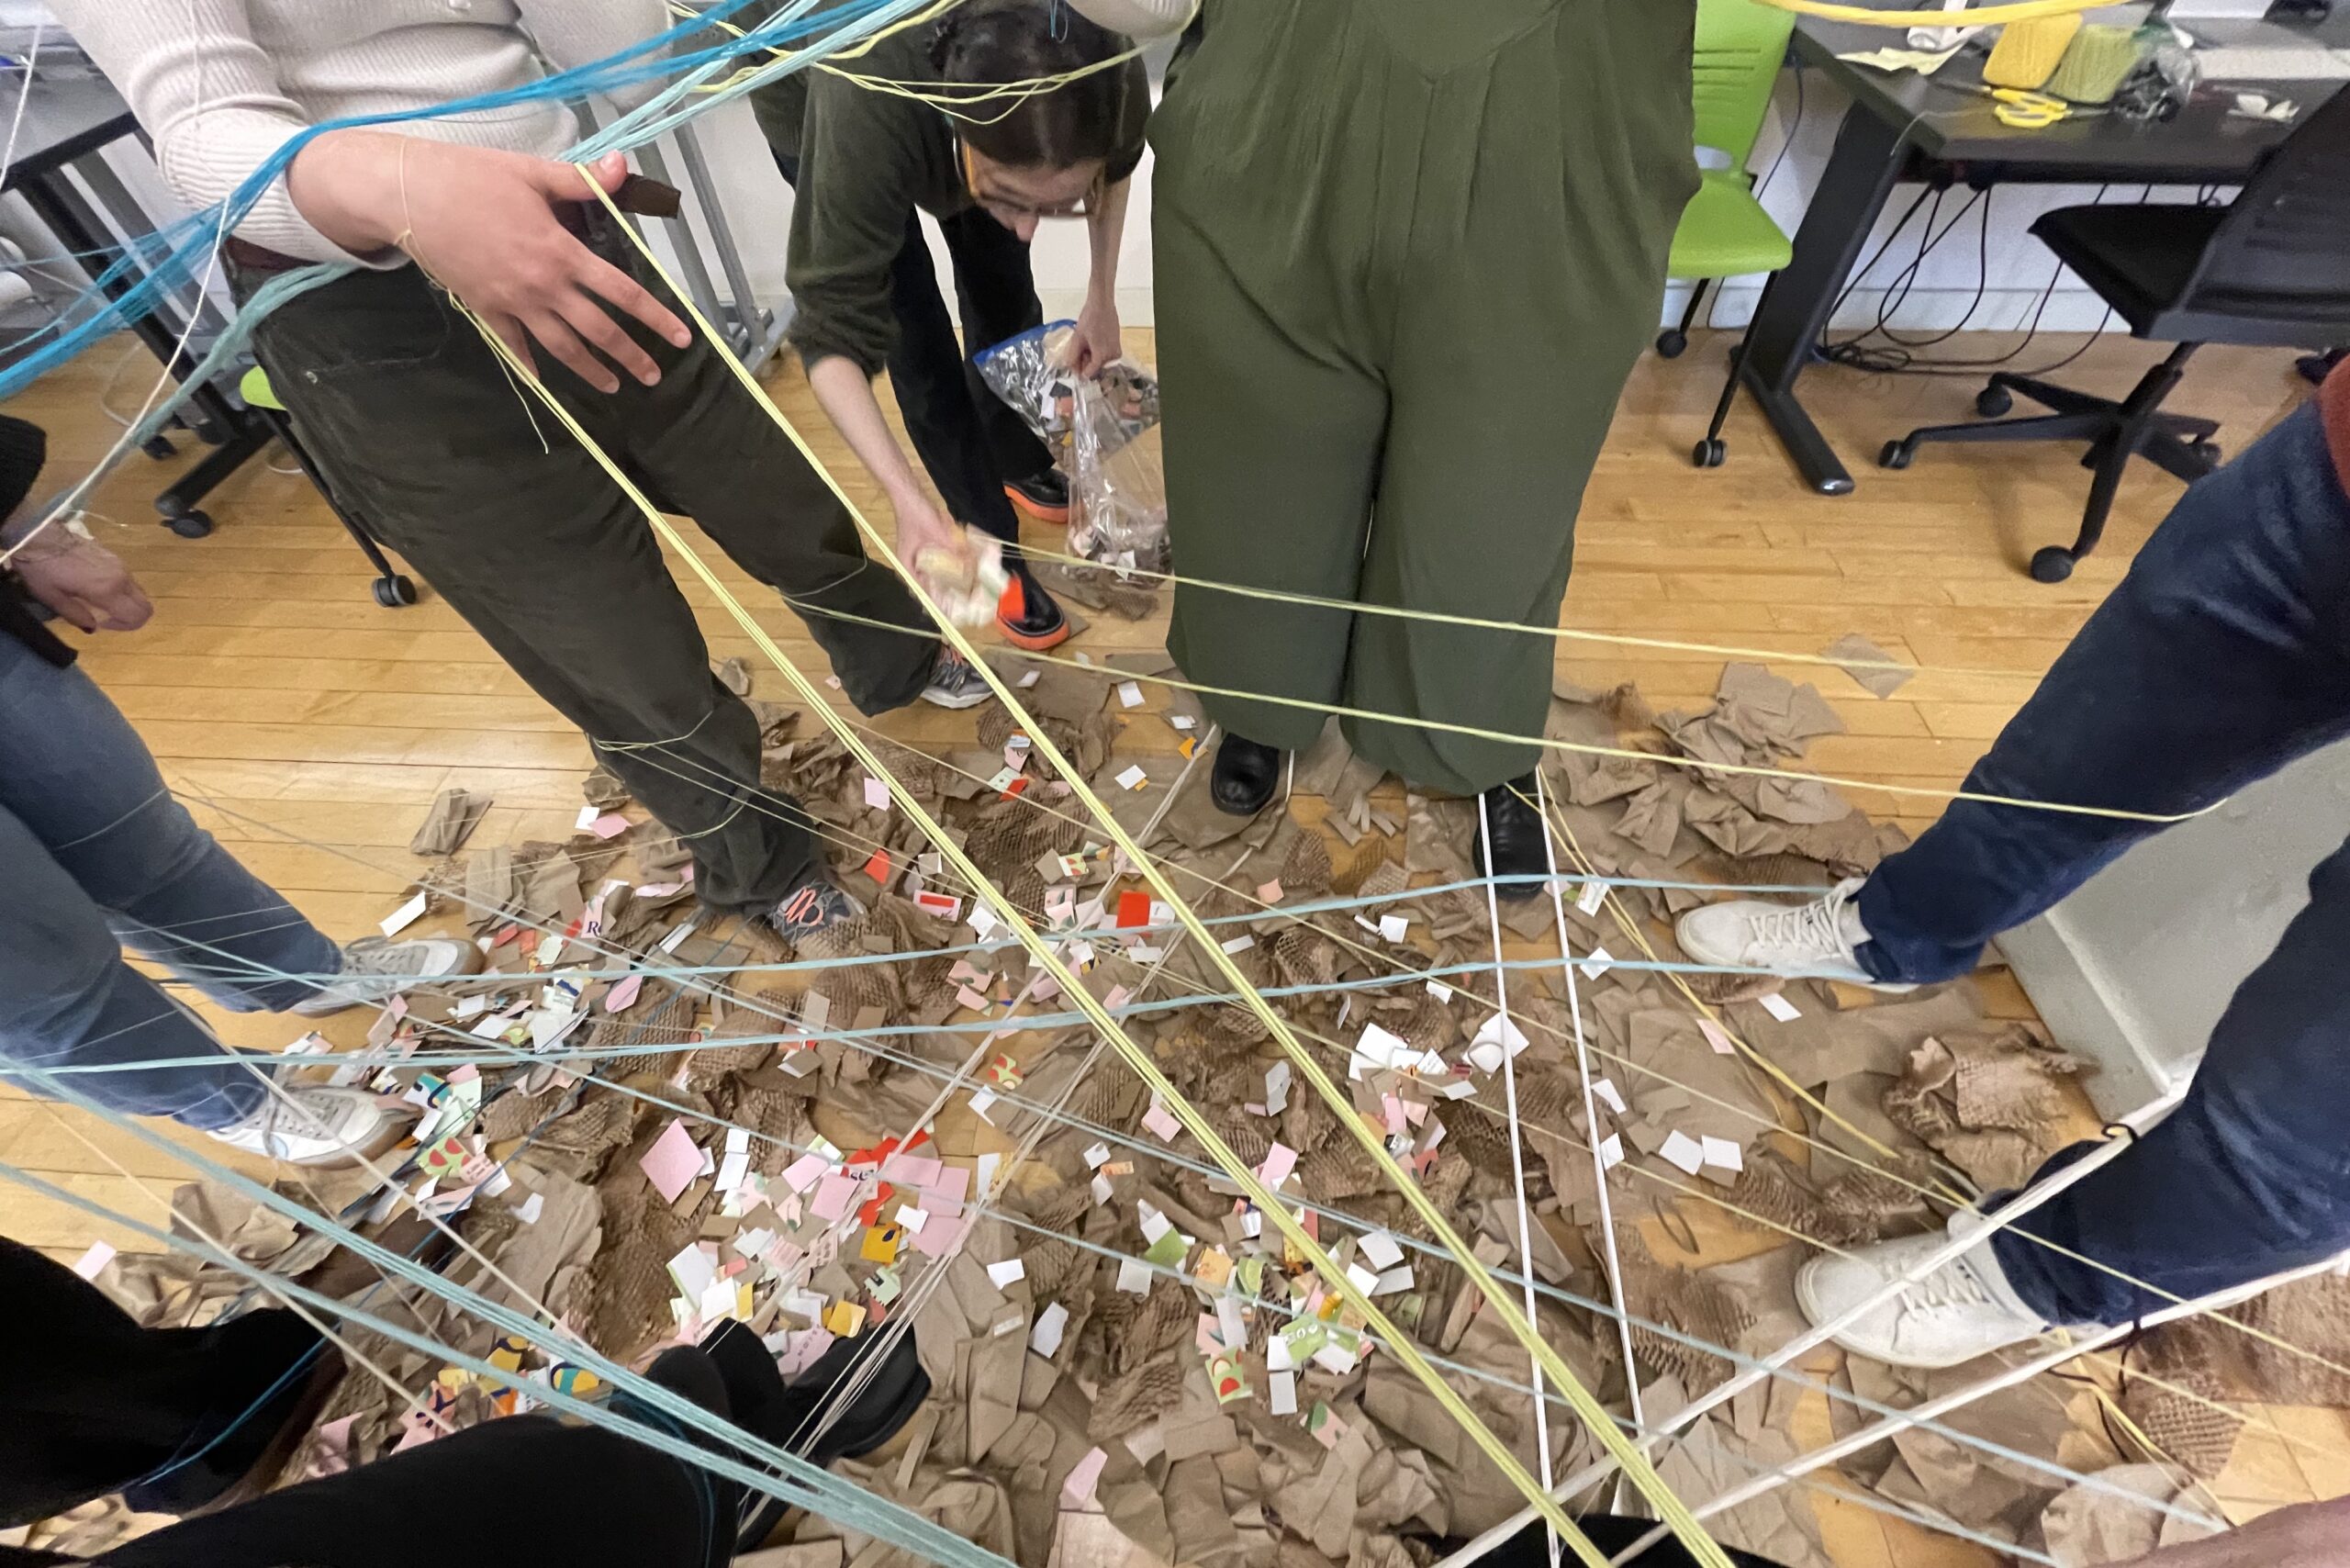
Figure 21. Figure 22. A “Data Maker” distributes the “absence” – cut up pieces of cardboard, and packing material – in the center and at the feet of the “Data Players” in the human network graph formation. This represents the 3,800 data points not used in the nodes and edges above. Photograph taken by Calista Donohoe, 2025.
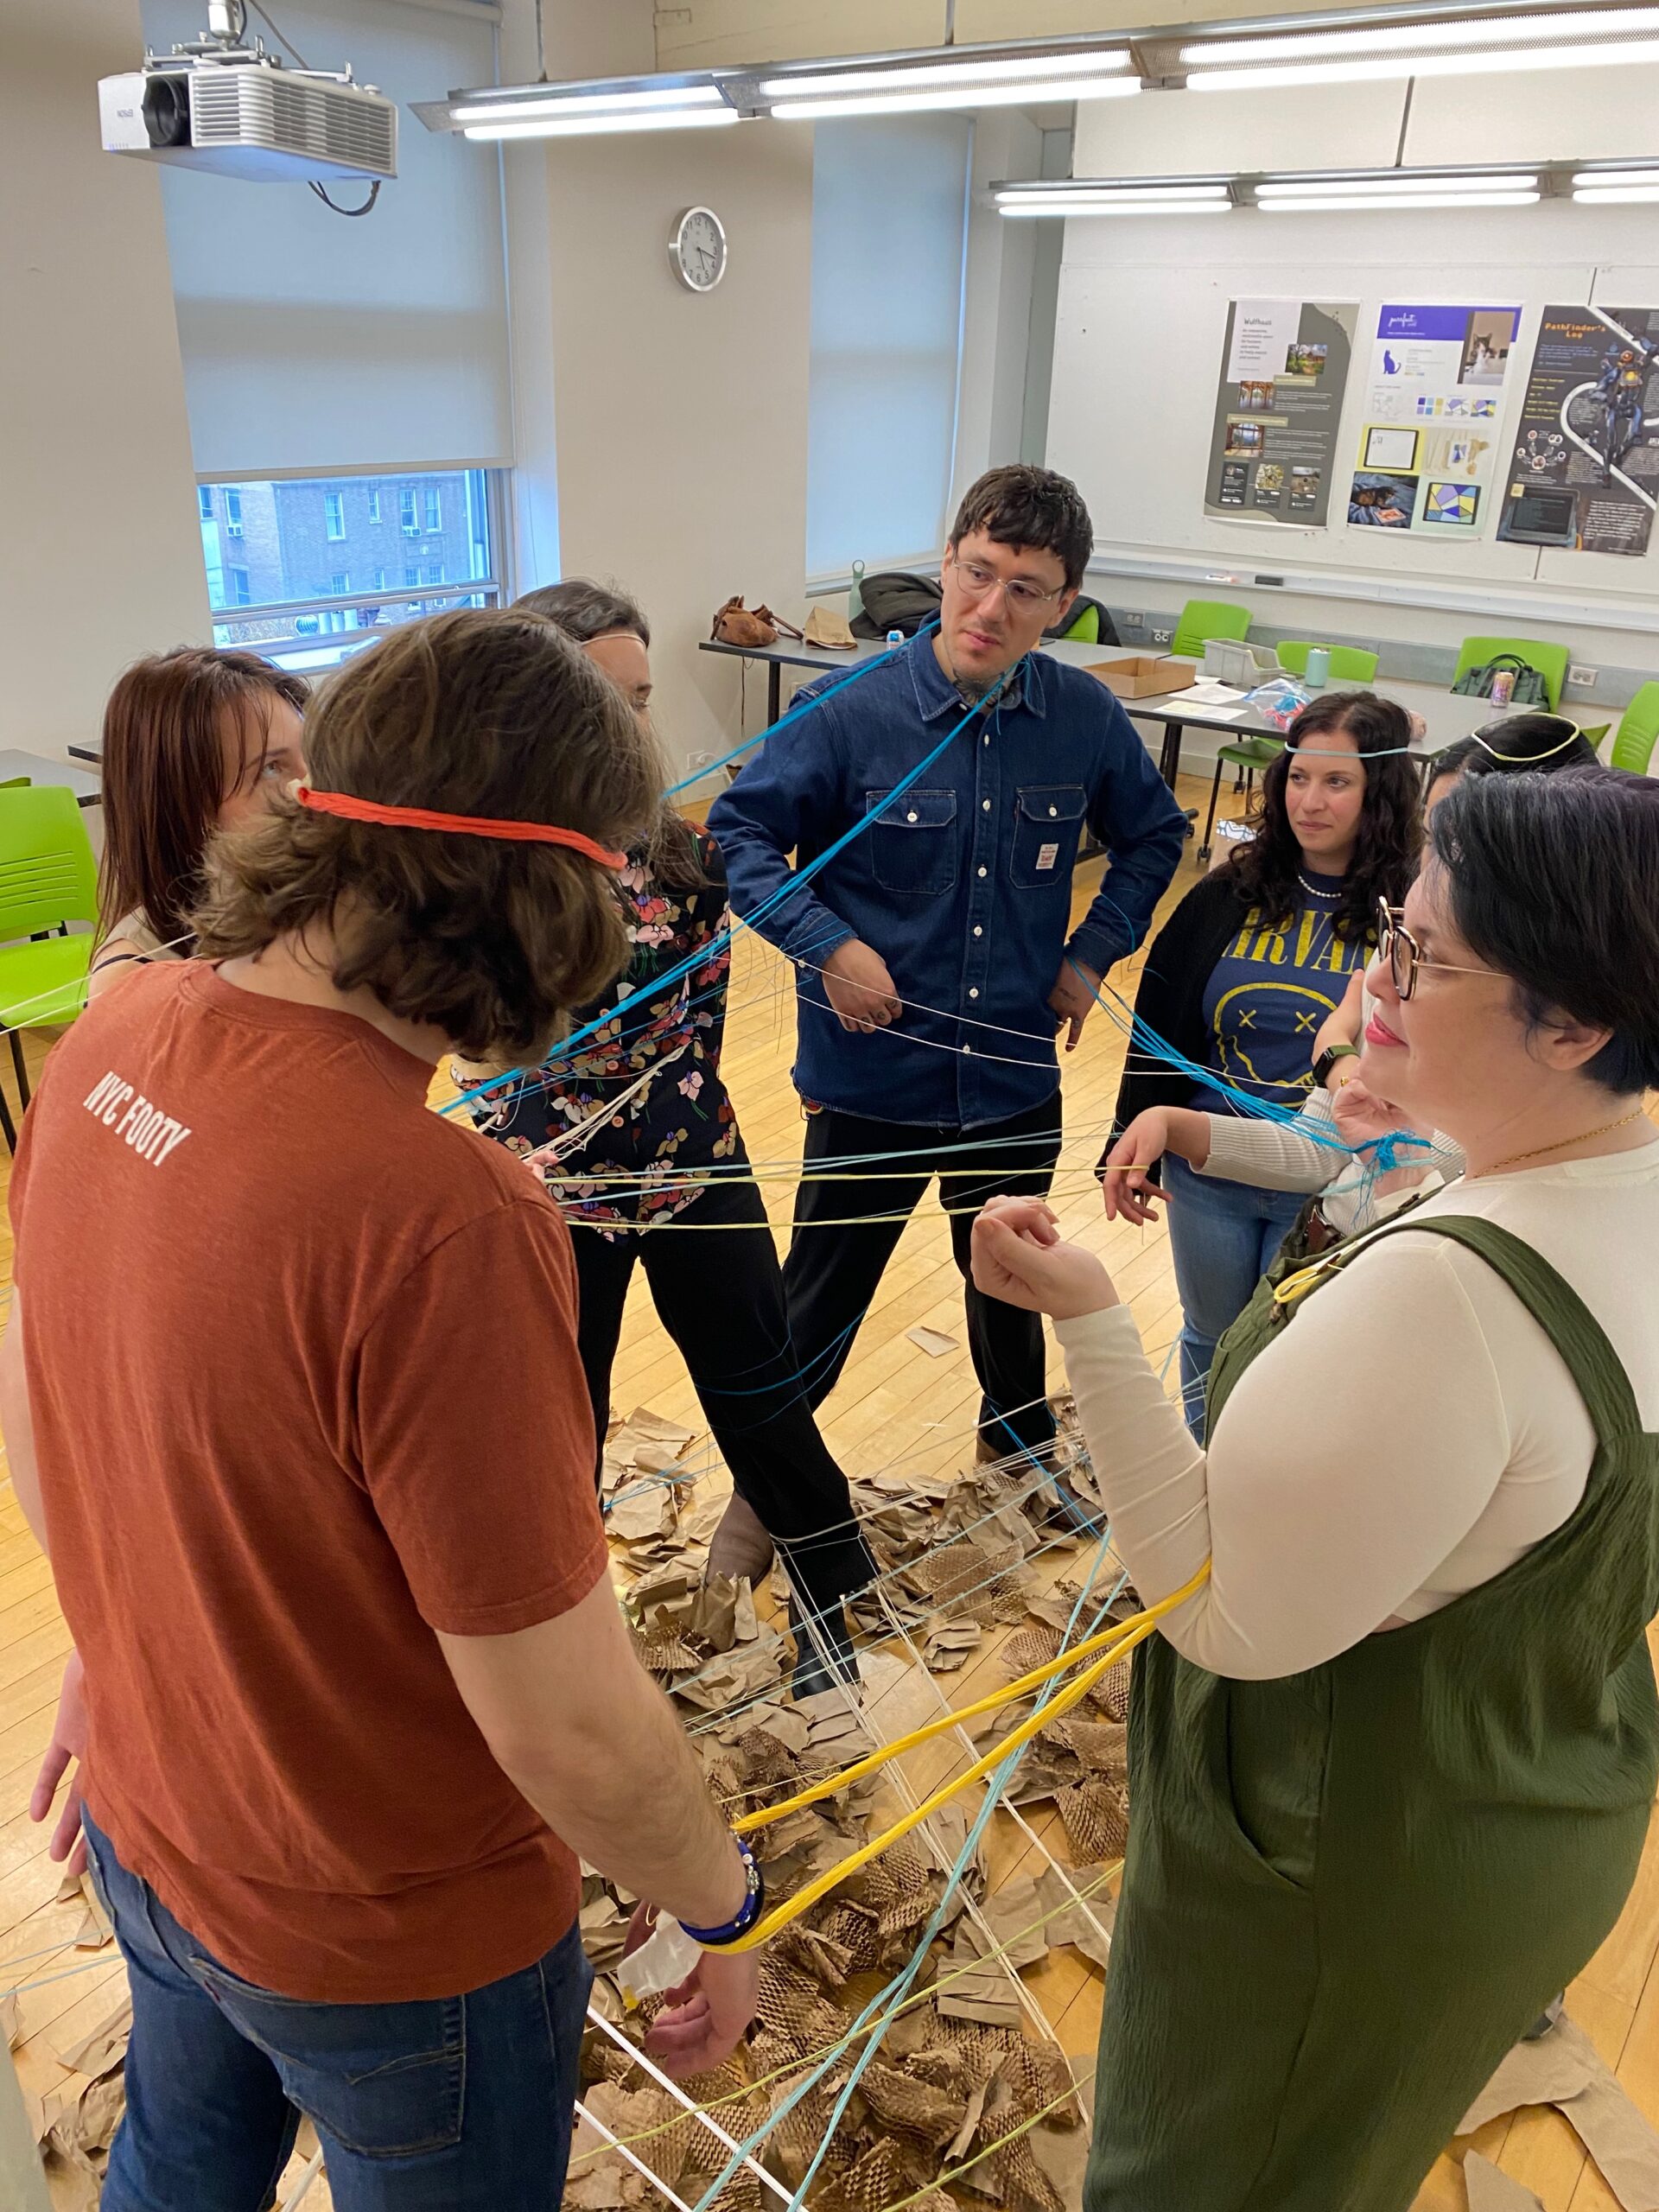
Figure 20. The workshop participants take a moment and check in after the wrapping has concluded.
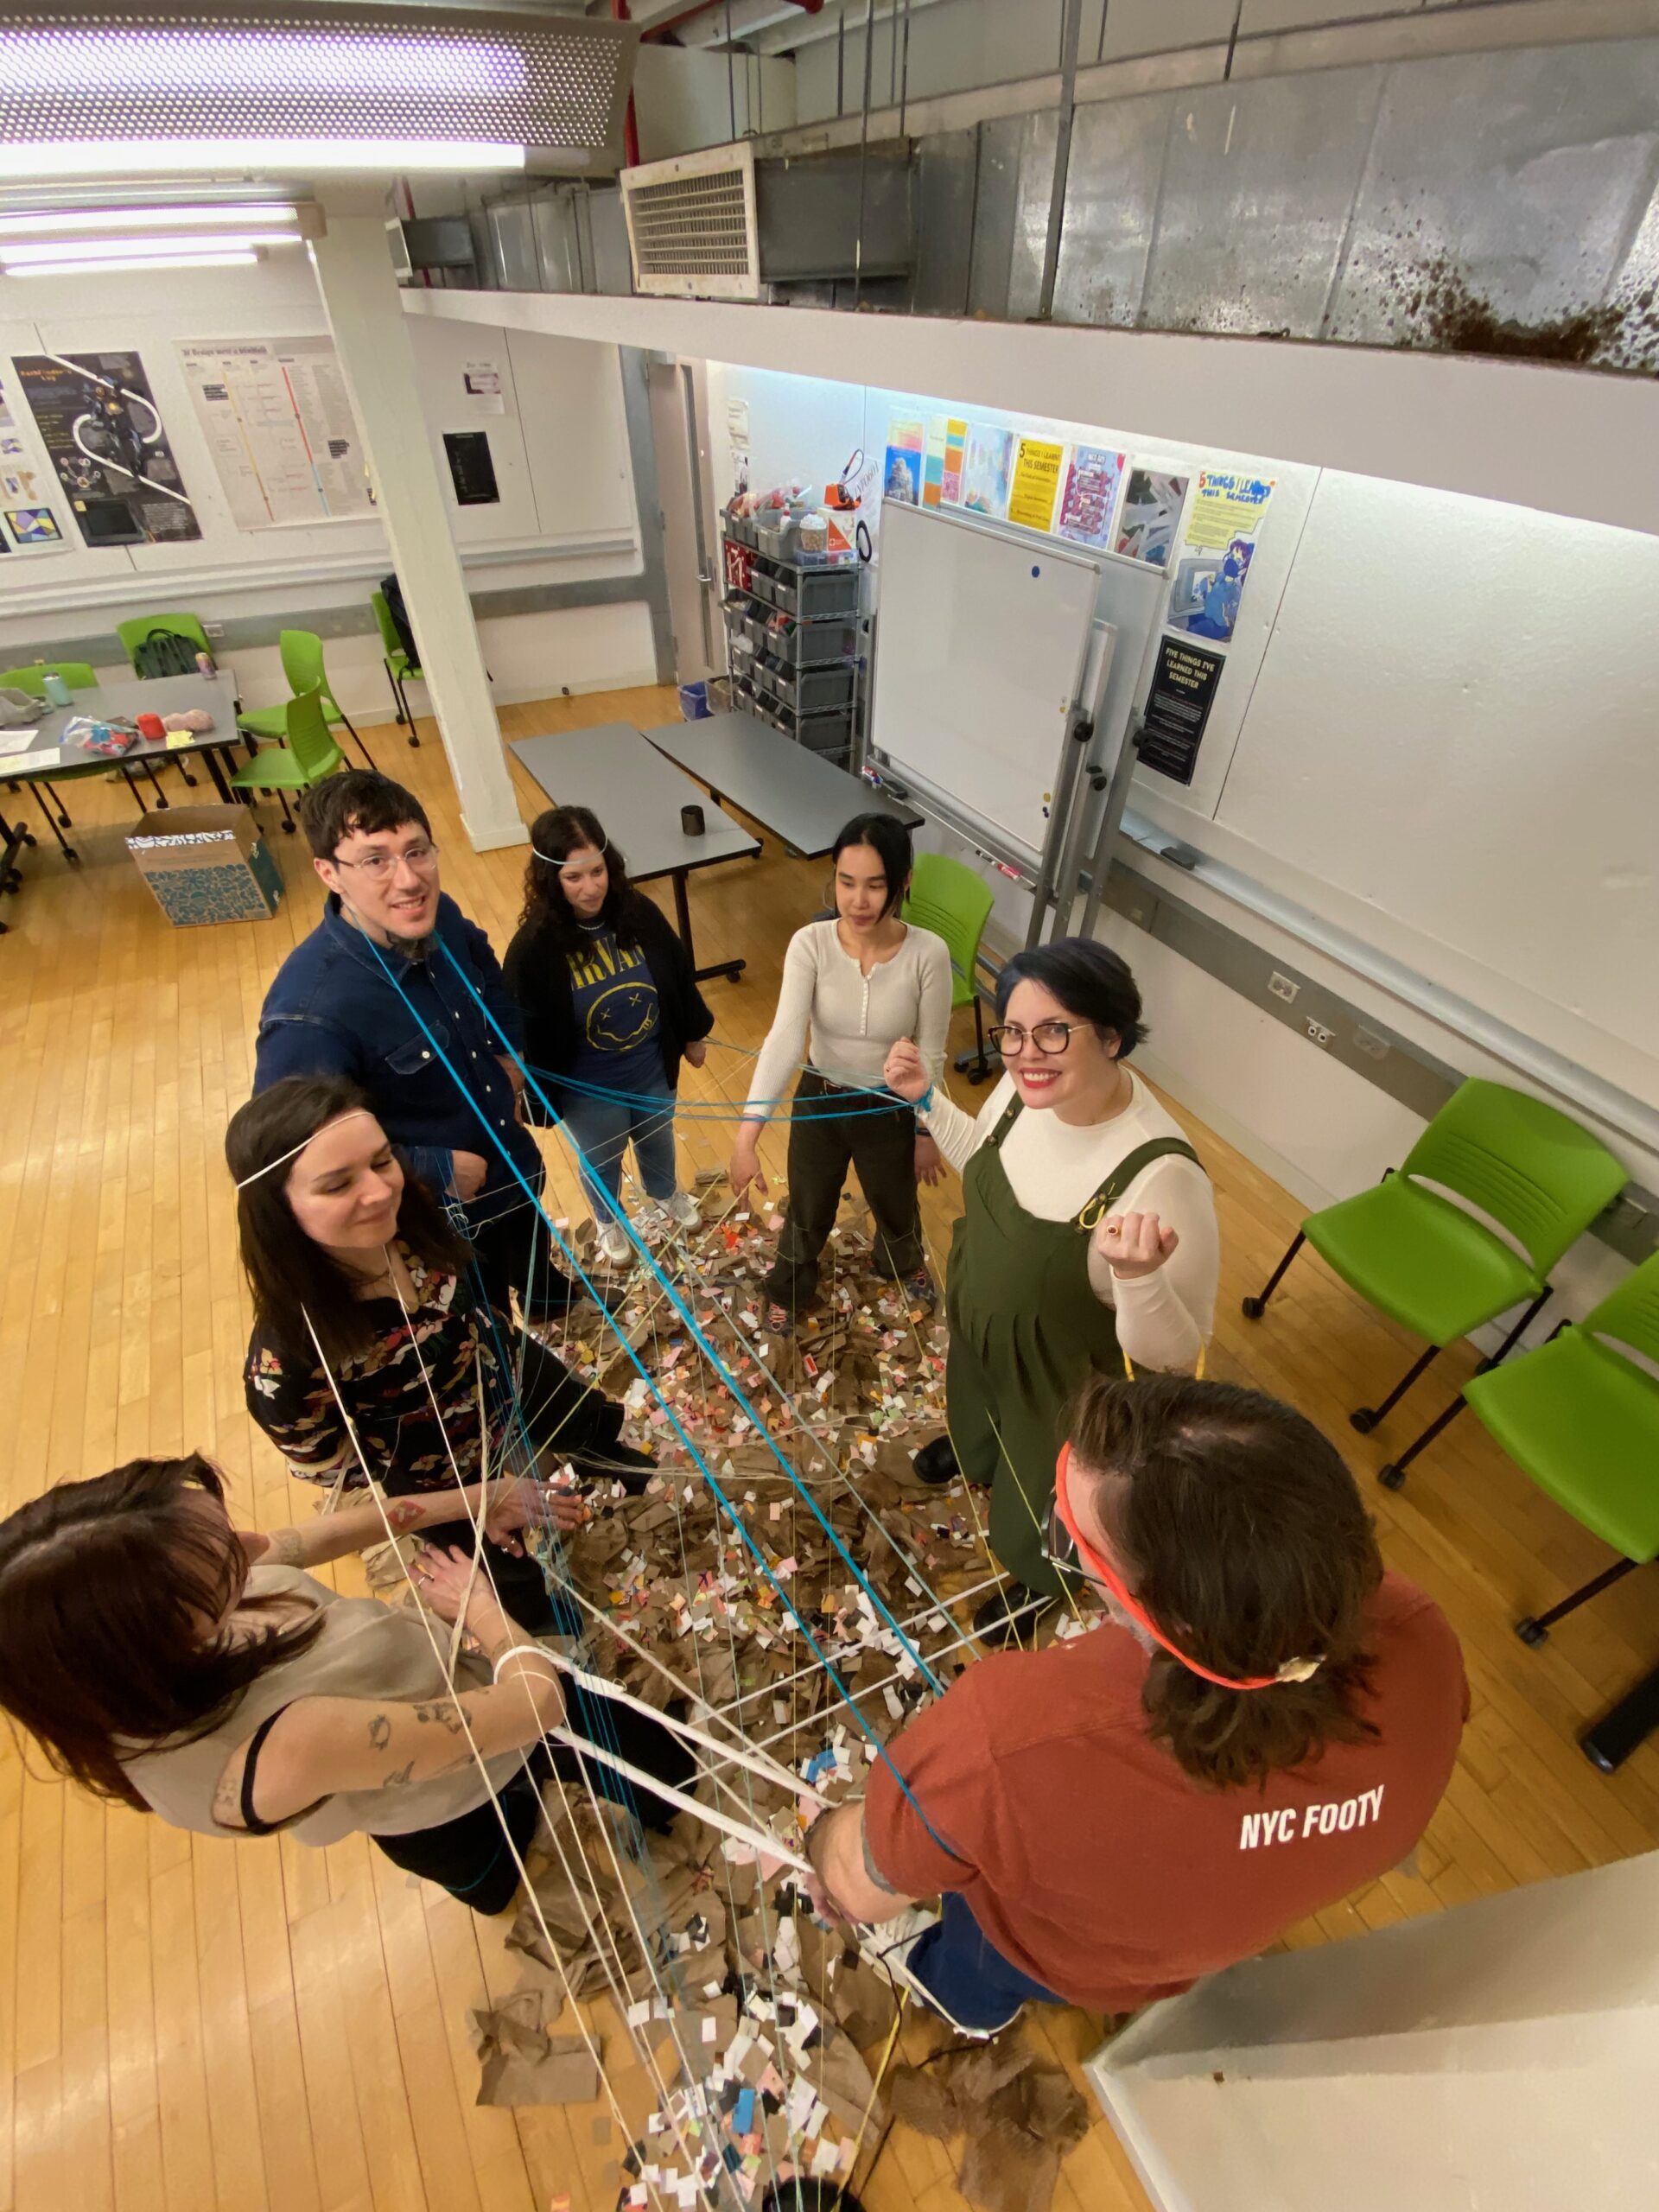
Figure 22. The workshop participants shot from above. As the only “Data Maker”, I had to complete the wrapping. Not pictured is the node -holder (the mic stand) that held all the loops I would need to slip into to complete the human network graph.
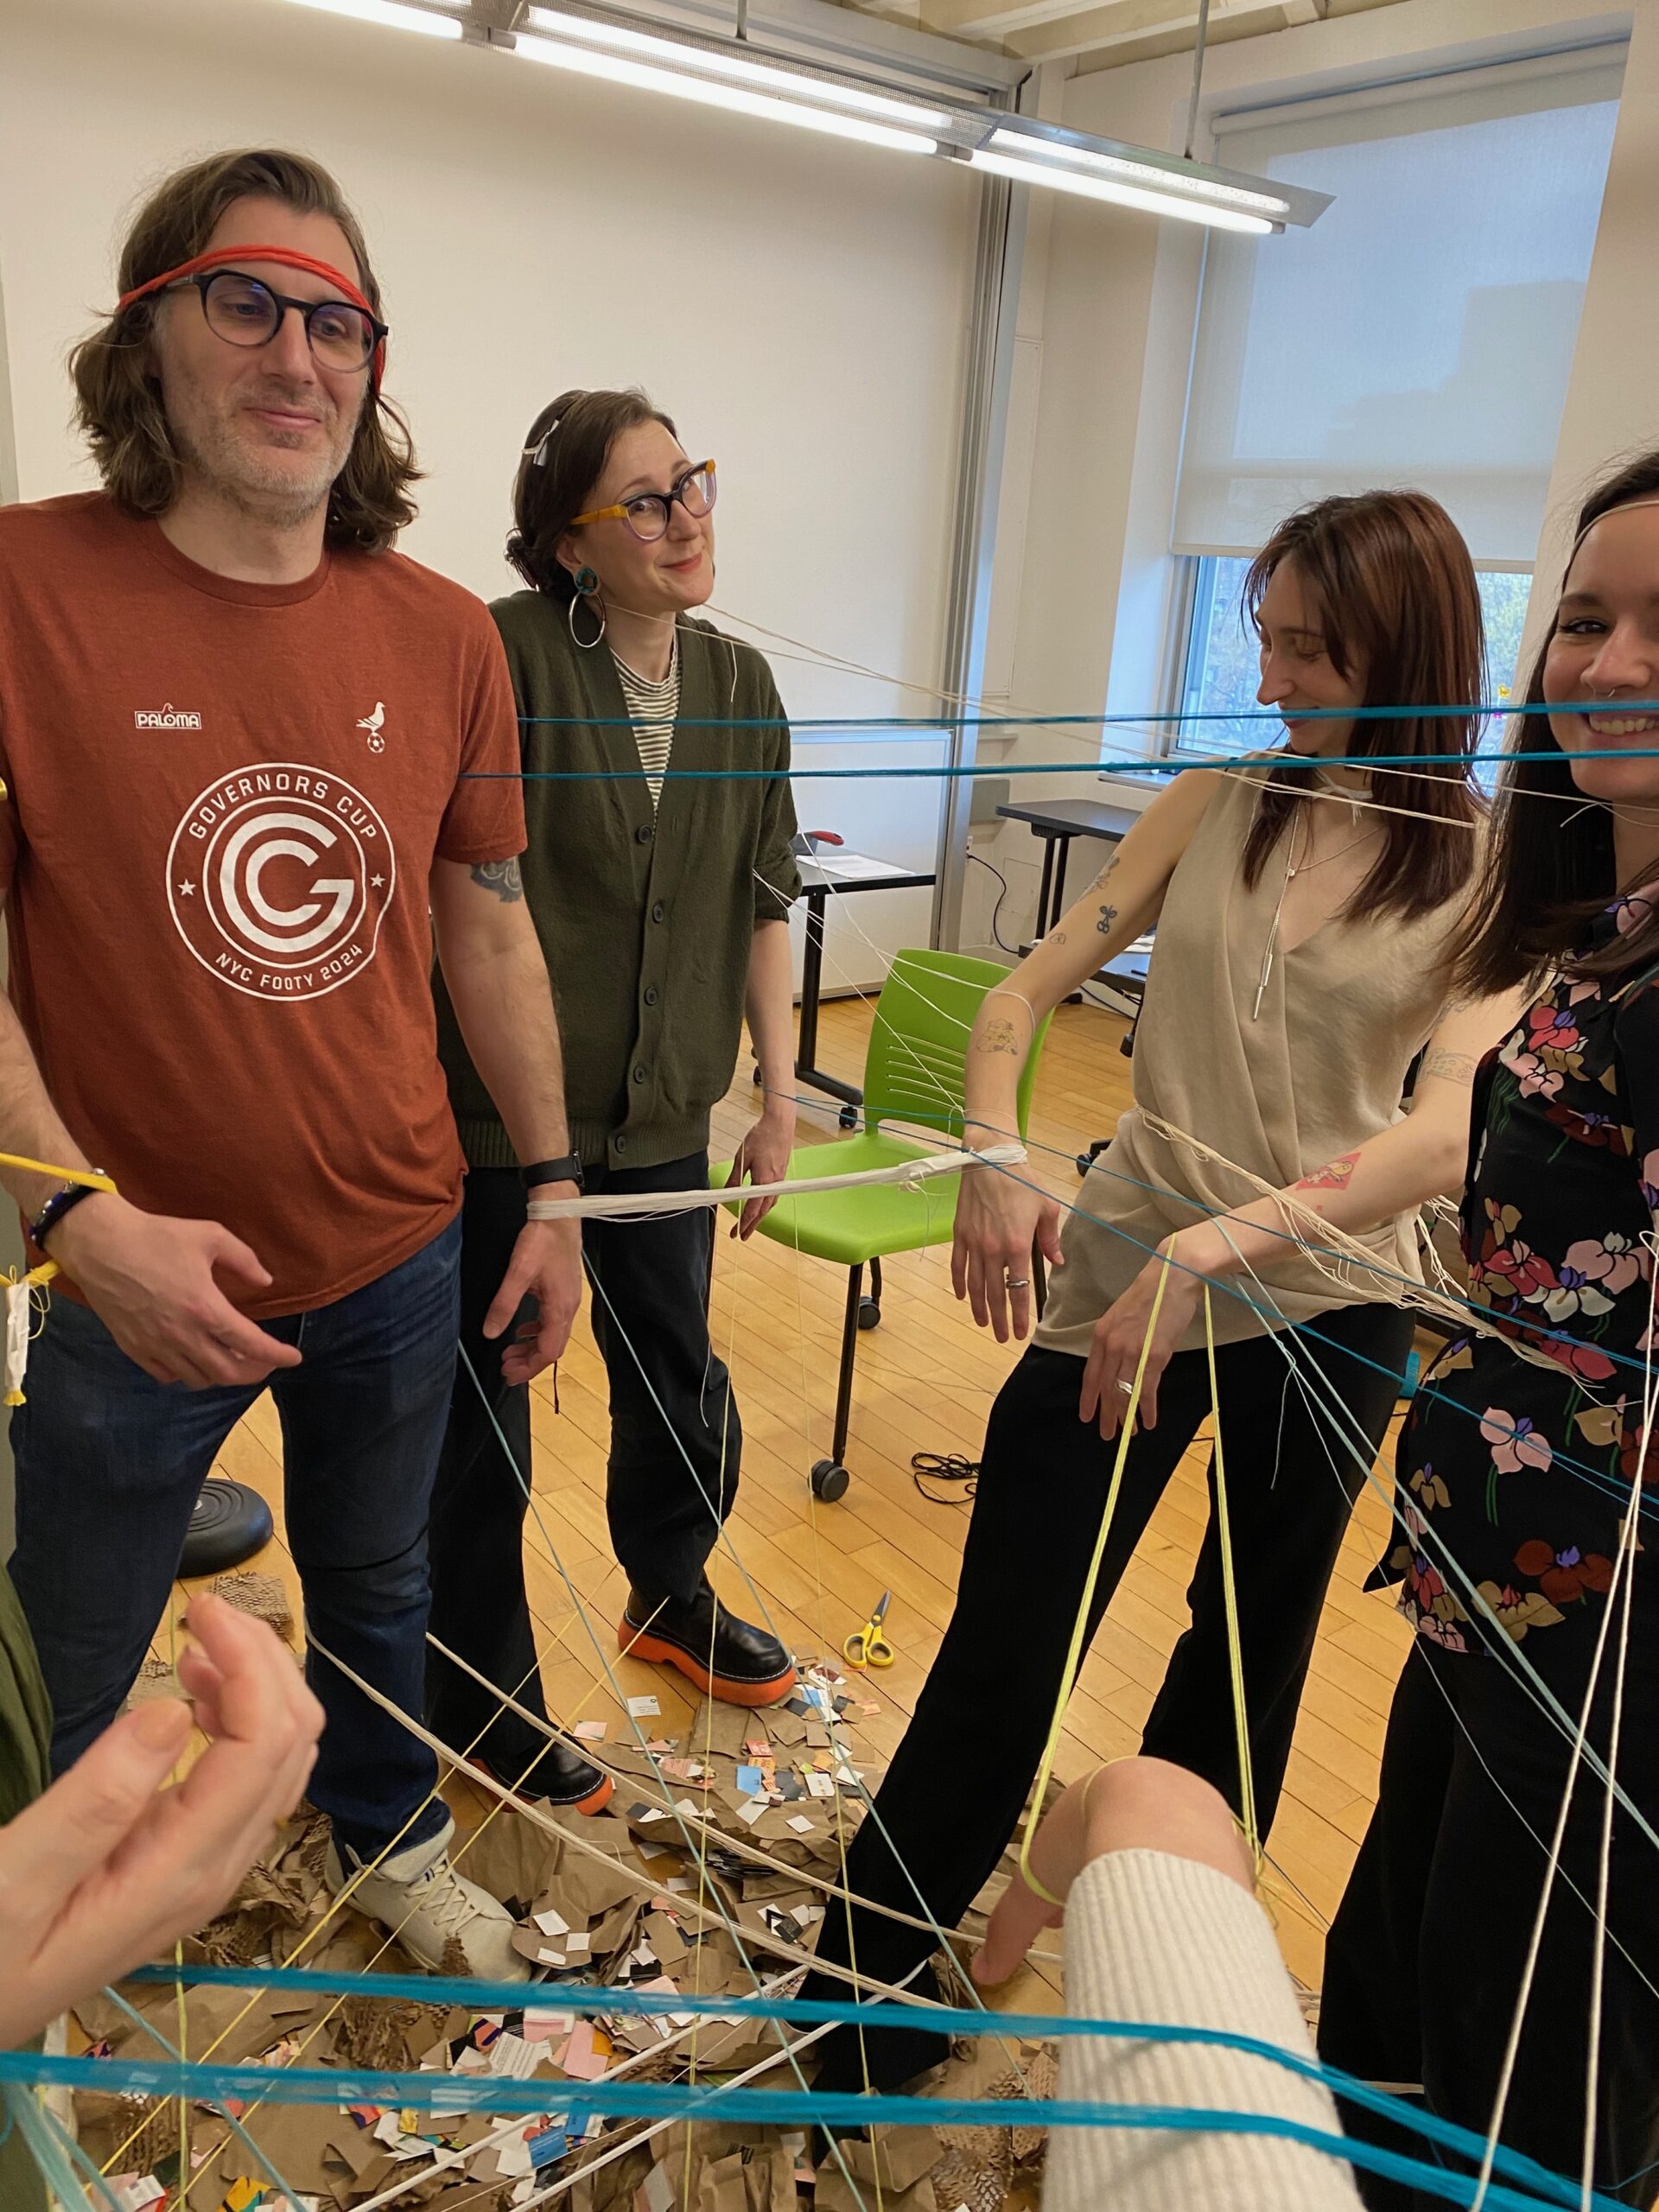
Figure 23. I finally made it into the network graph! Photograph taken by
Kelsey Kiantoro, 2025.
- The 8 Data Players place themselves in a spread-out formation:
- Interaction and Response (Tactile and aural engagement, visual evaluation)
- The Data Makers walk around the Human Network Graph and “activate” the nodes by gently pulling or pushing on the arm, leg, or torso of a particular Data Player where the loops of thread are attached. The Data Players that make up that “source” and “target” configuration will then vocalize the name of the artist they are representing as the node.
- Post Activity Discussion (( argue with))
- After the activity concludes and all the participants have extracted themselves from the network graph, the facilitator will encourage everyone to gather around for a discussion.
- Suggested investigative and prompting questions to ask during this time:
- Which artists were chosen together the most? Which pair were the least chosen together?
- Do you feel like you understand the data better before we made the Human Network Graph? In what ways did you or didn’t you?
- What did you learn from each sense (hearing, seeing, touching)?
- What do you find most challenging about the activity?
- What did you find most fun or interesting?
- Is there anything that you have encountered in your real life that this reminds you of?
- What do you think happens to the data that doesn’t make it into the charts and graphs that you see presented in your daily life (online, advertisements, media)? What do you think could be missing from those presentations based on what you experienced today?
- Were you surprised by anything you experienced today?
- After the activity concludes and all the participants have extracted themselves from the network graph, the facilitator will encourage everyone to gather around for a discussion.
- Clean Up Time!
- Everyone pitches in to collect the “absence” pieces for recycling
- The string can be kept by the participants, reused, or recycled
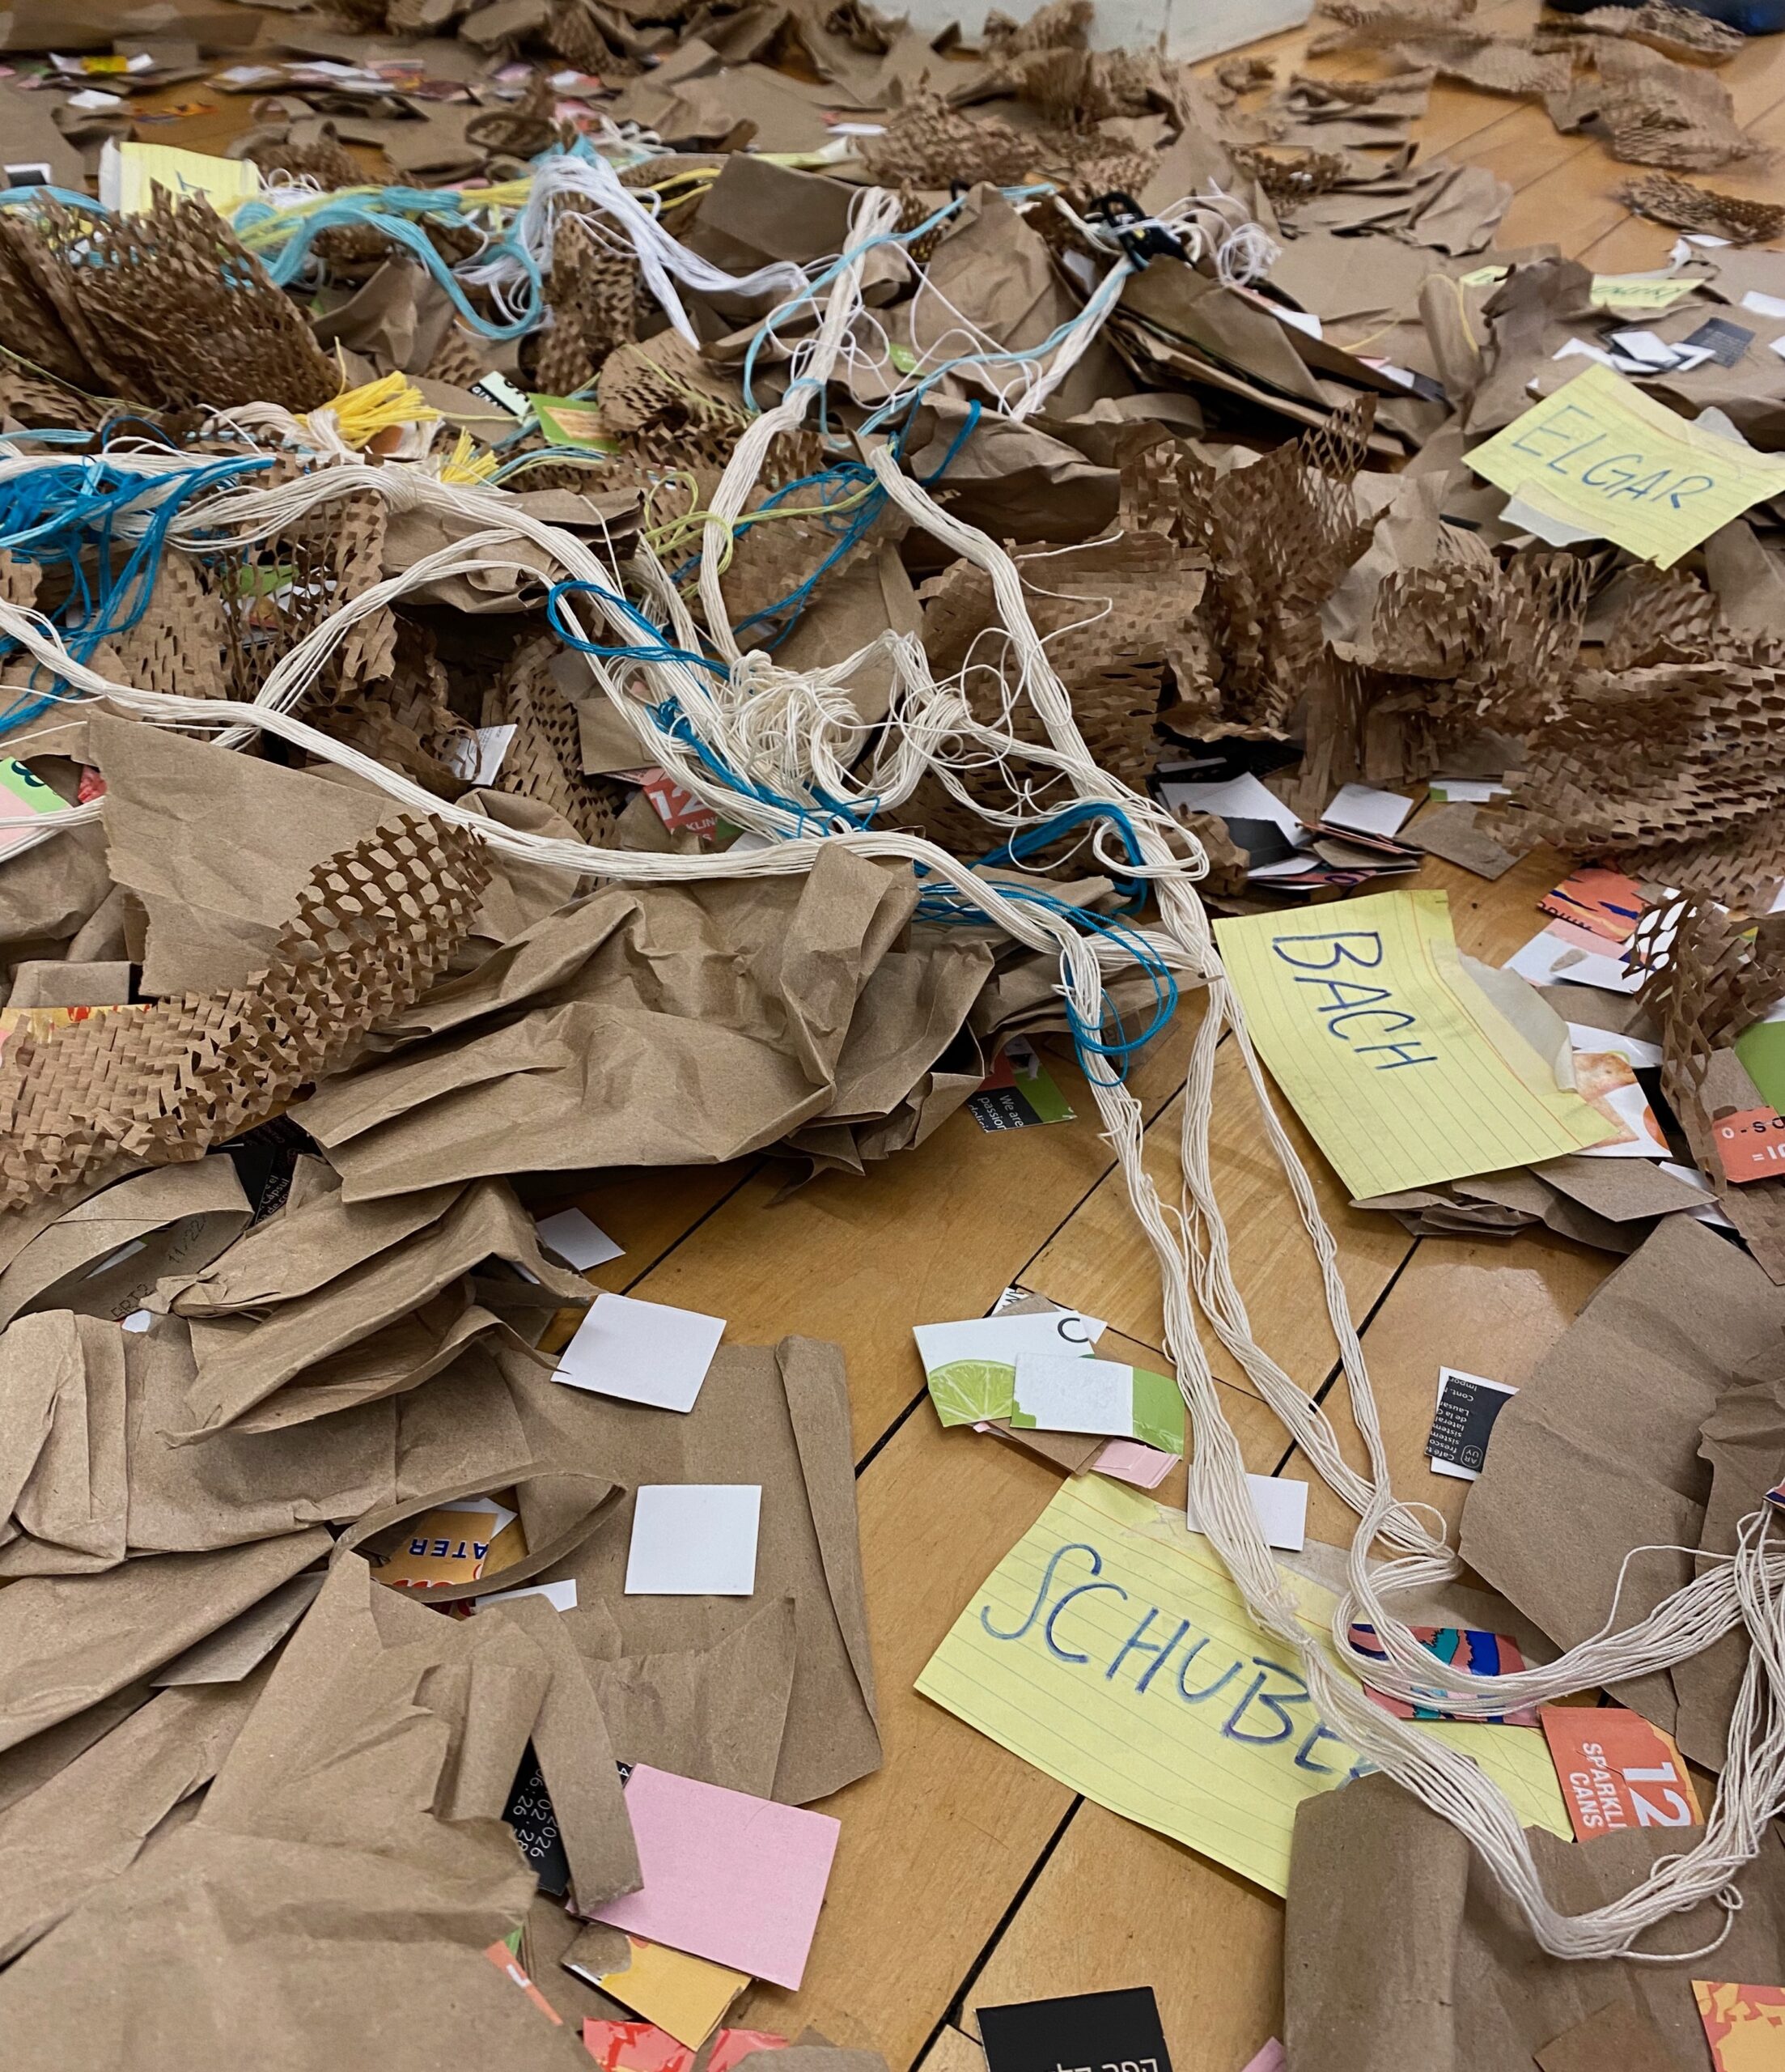
Figure 24. The aftermath – close up of the “absence” and thread on the floor after the workshop wrapped.
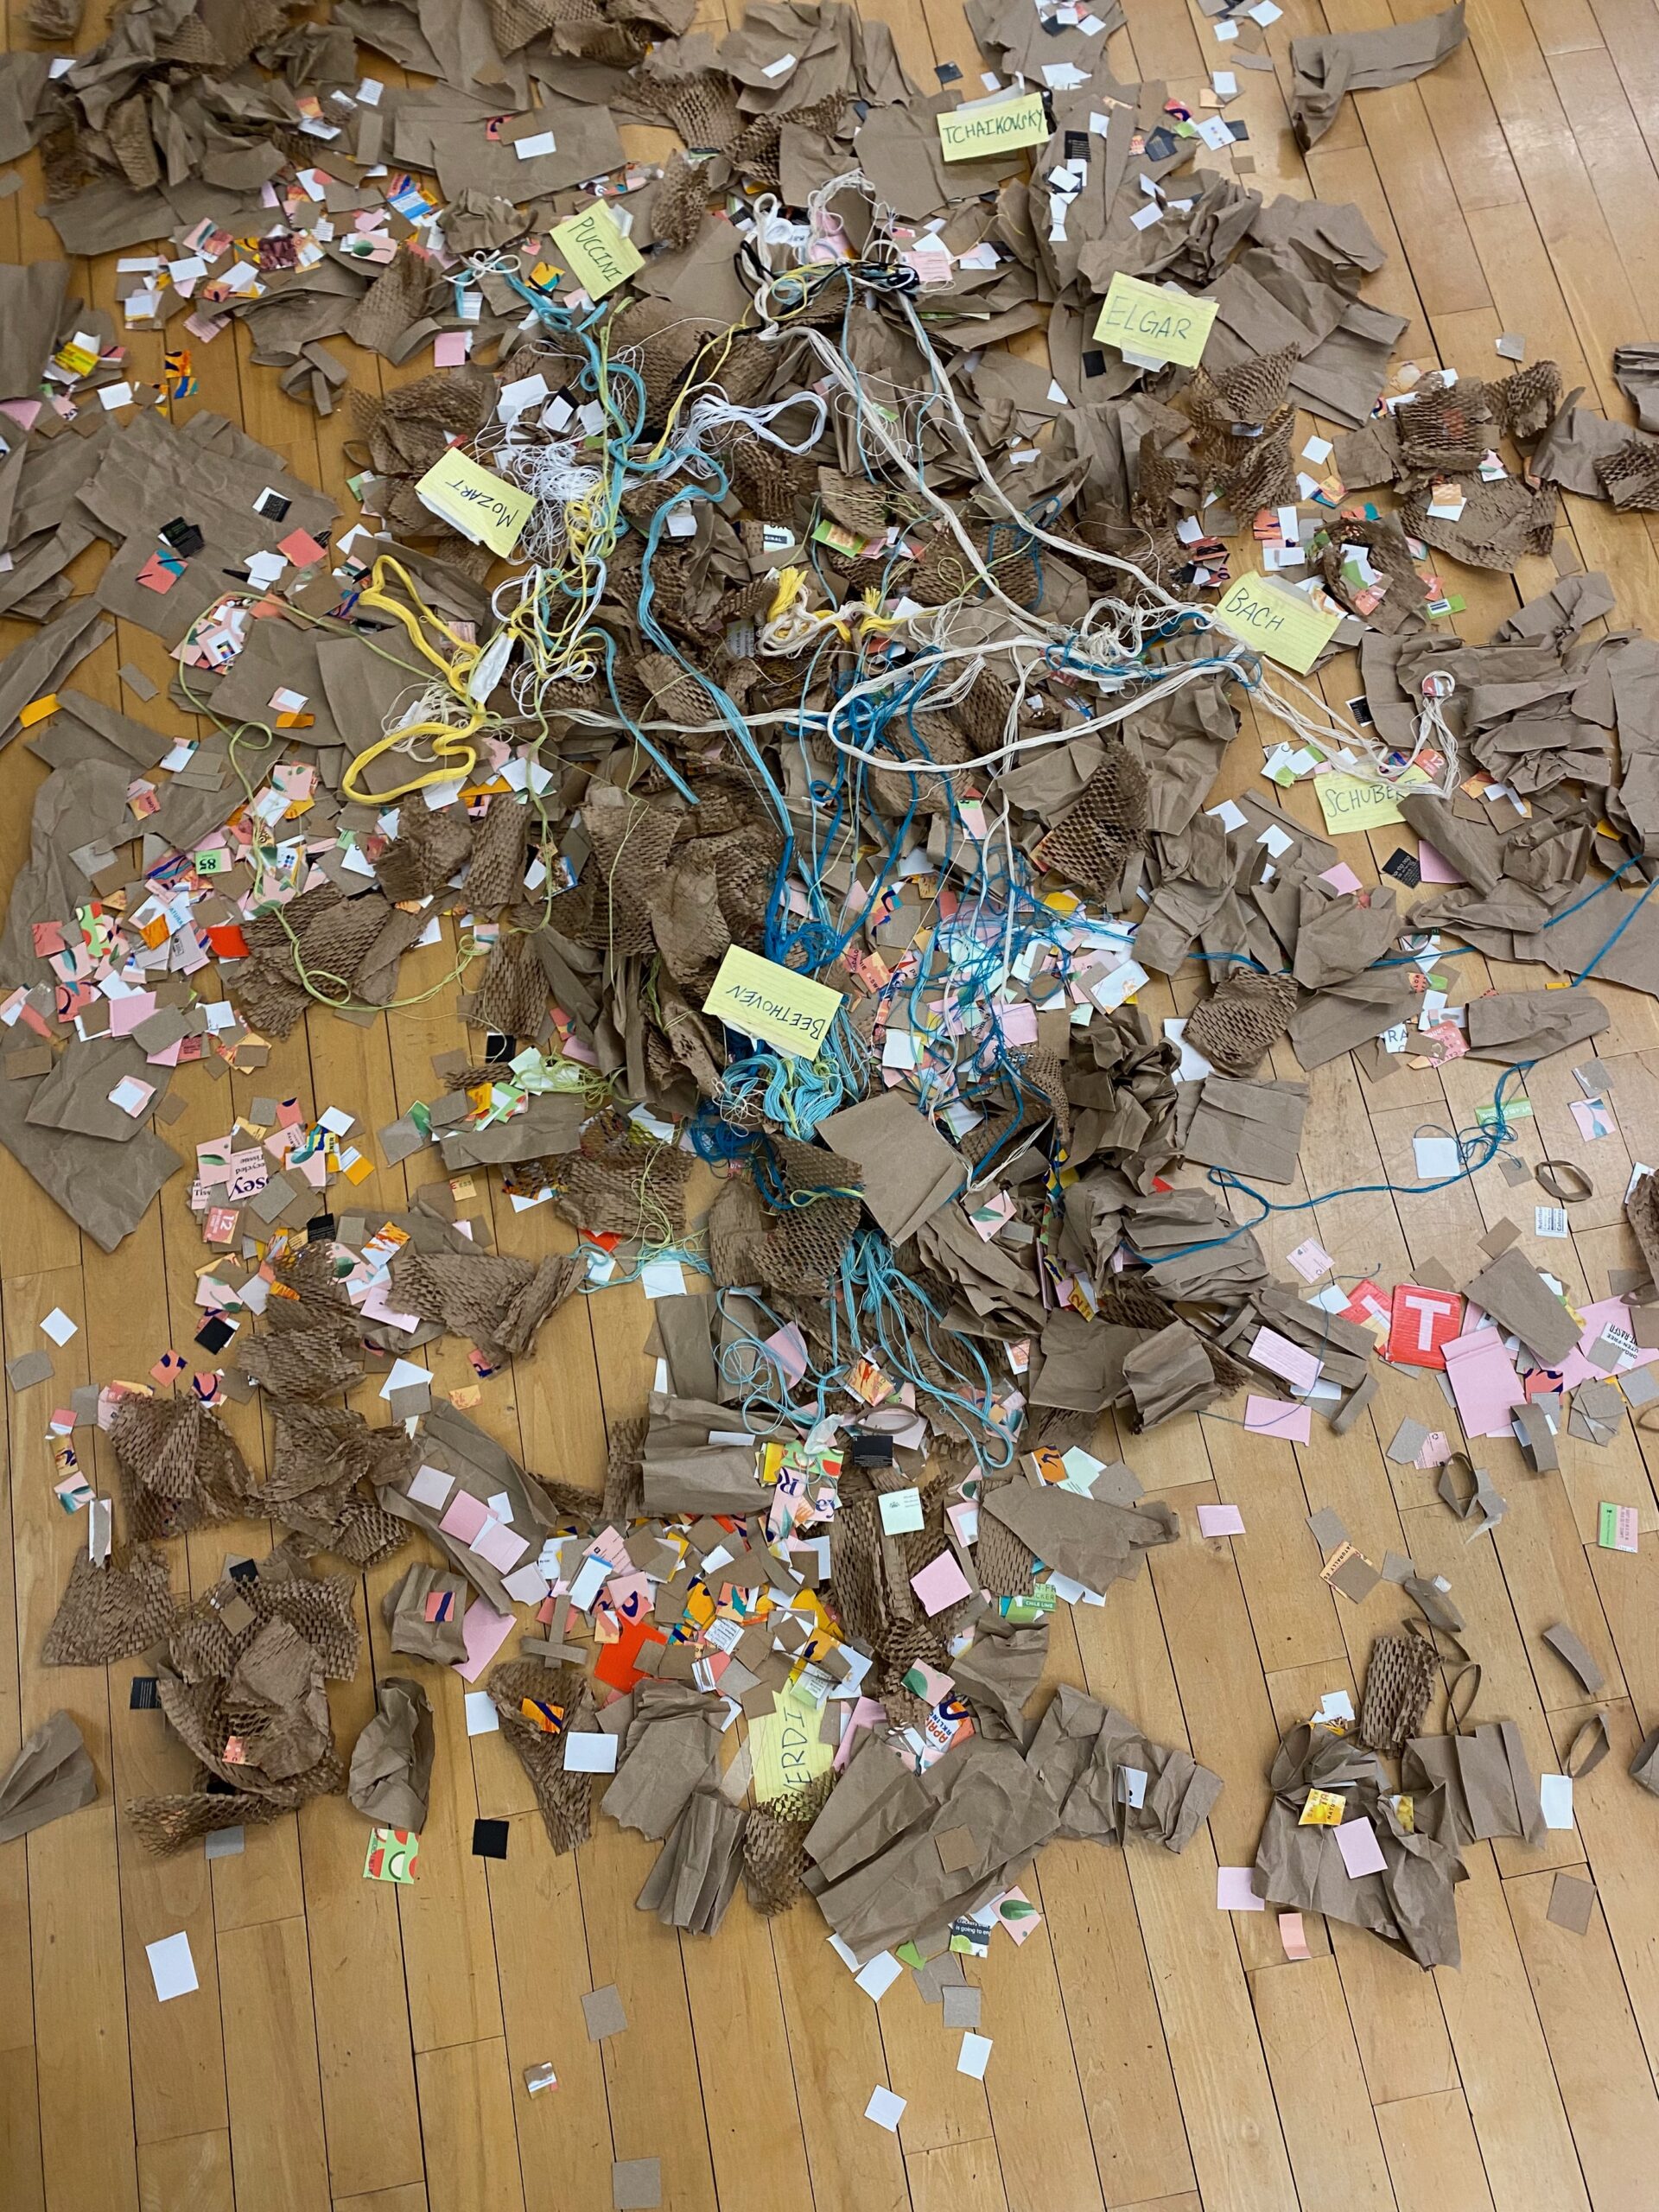
Figure 25. The aftermath – overview of the “absence” and thread on the floor after the workshop wrapped. This was then collected and recycled.
Share your Feedback
If you have facilitated or participated in the workshop activity above, please fill out this feedback form. I would love to hear about your experience. The hope is to use your feedback to improve the workshop in future iterations.
Acknowledgements
I would like to extend a special thanks to the following folks for participating in the experimental trial run of “Top 8 Workshop: Exploring Embodied Cognition Through Data Visceralization”. Their collective openness, willingness to play, and trust facilitated such a meaningful experience that brought to life an idea on paper. Thank you Veneranda Aguirre, Calista Donohoe, Kelsey Kiantoro, Scarlett Moldovan, Chris Moscardi, Nene Villalobos, and Sara Zucker!
Additionally, thank you to Anthony Cocciolo, Dean of the Pratt Institute School of Information, for providing the access/space on campus to run the workshop. I appreciate your continued support of alumni’s data/digital humanities research.
I also wanted to recognize and highlight the contribution of the initial project group, Carol Choi, Ava Kaplan, and Lubov McKone. Their collaboration, ingenuity, and research not only help shaped the trajectory of this workshop, but challenged the bounds of the Digital Humanities domain. I am honored to have collaborated with such thoughtful people.
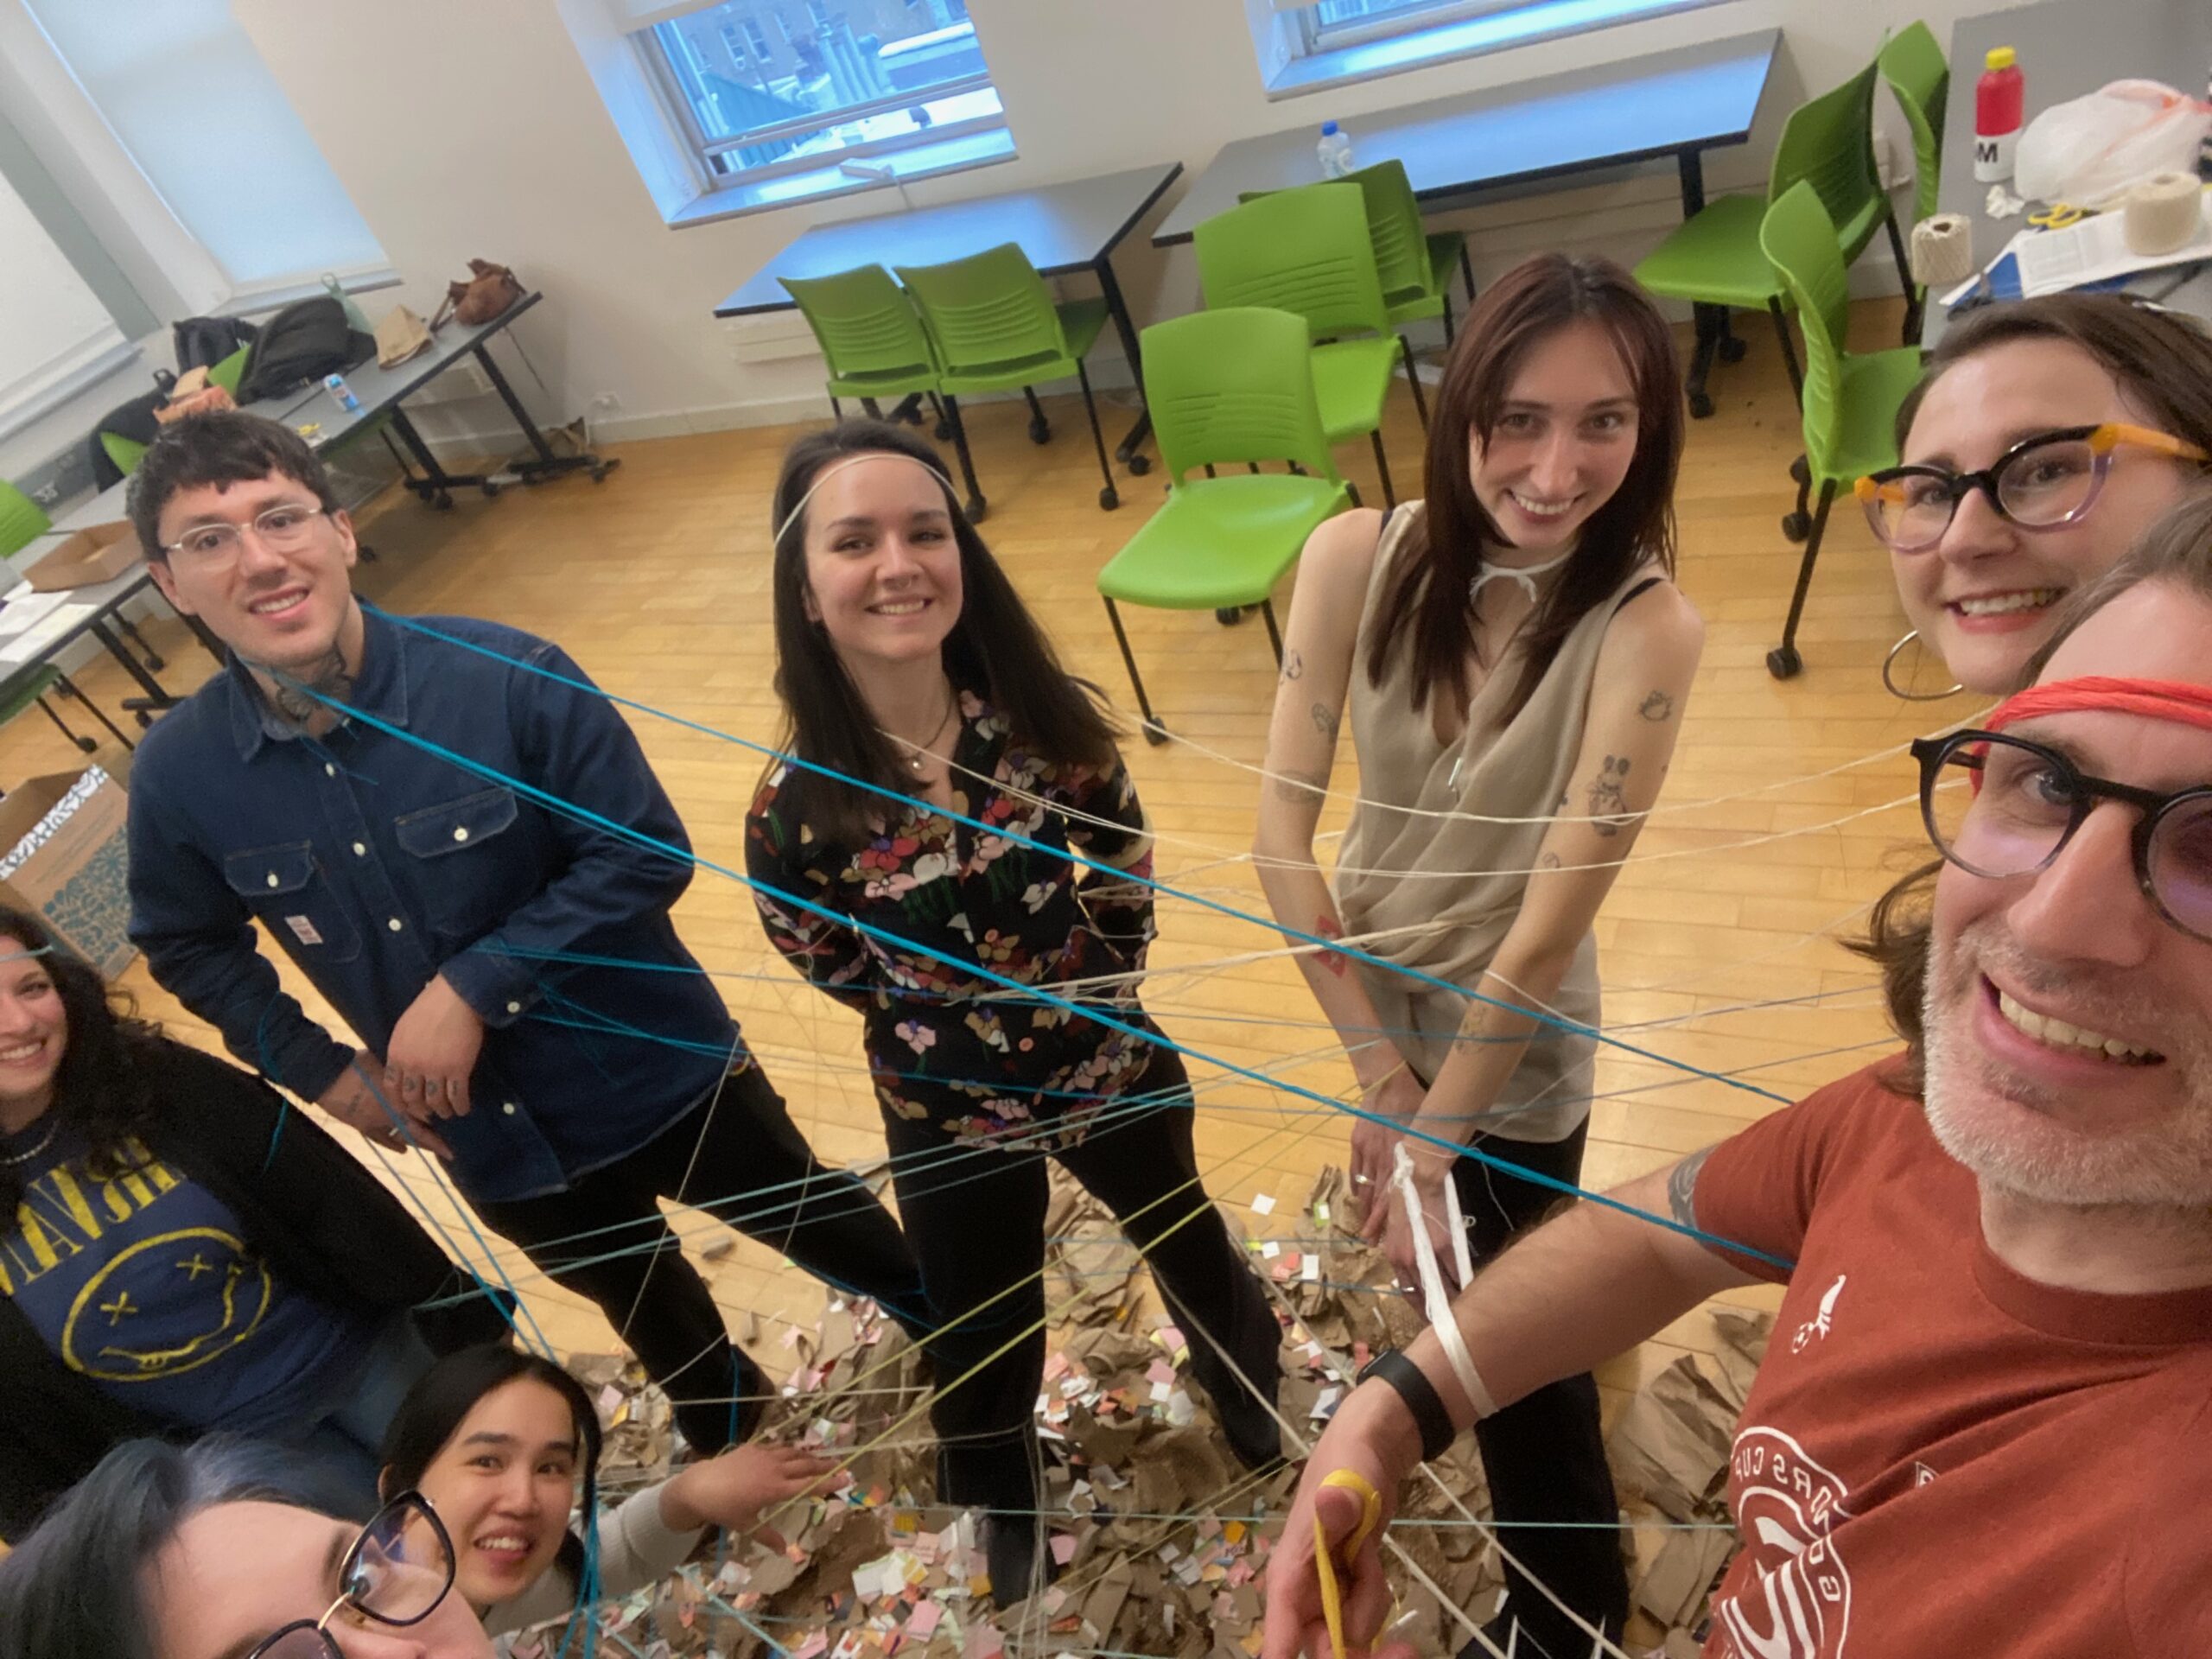
Figure 26. Workshop selfie!
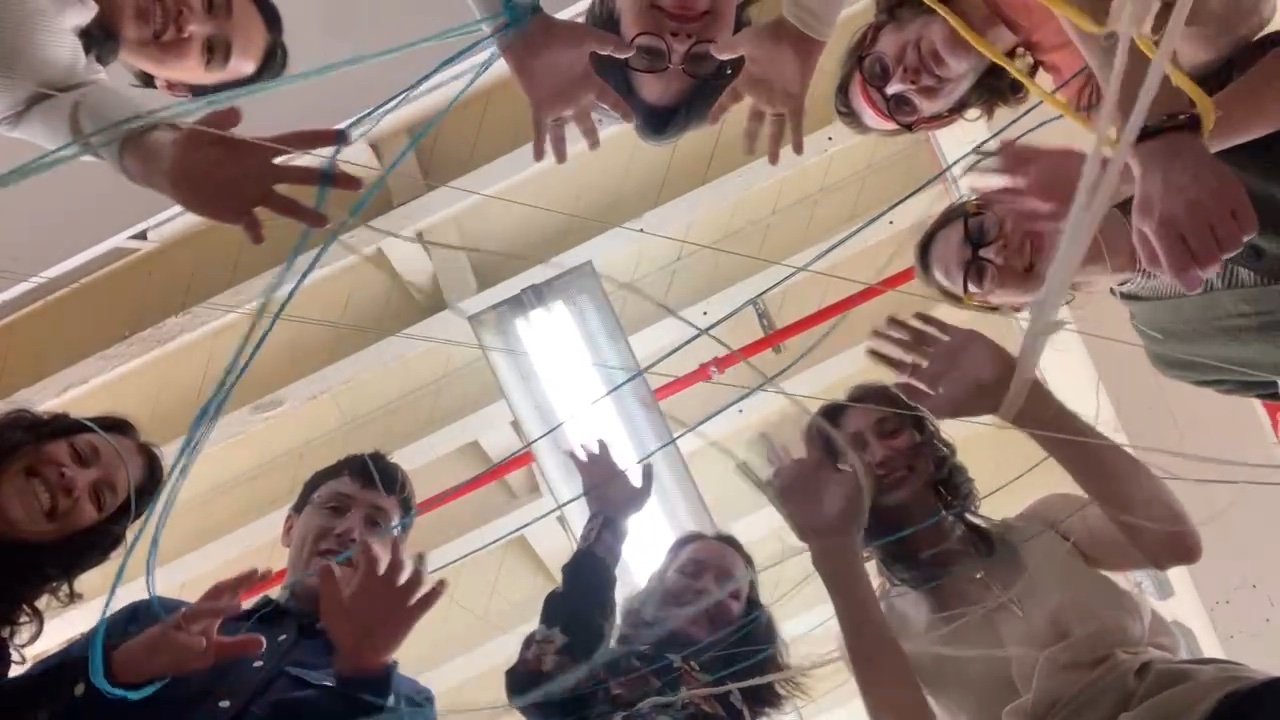
Figure 27. The trial workshop crew upon completing the activity. Pictured from top left going clockwise: Kelsey Kiantoro, Veneranda Aguirre, Chris Moscardi, Jessika Davis, Scarlett Moldovan, Calista Donohoe, Nene Villalobos, and Sara Zucker.
Bibliography
Barsalou, Lawrence W. 2008. “Grounded Cognition.” Annual Review of Psychology 59 (Volume 59, 2008): 617–45. https://doi.org/10.1146/annurev.psych.59.103006.093639.
Bhargava, Rahul, and Catherine D’Ignazio. 2015. “Designing Tools and Activities for Data Literacy Learners.” MIT Media Lab. 2015. https://www.media.mit.edu/publications/designing-tools-and-activities-for-data-literacy-learners/.
Choi, Carol, Jessika Davis, Ava Kaplan, Lubov Mckone, and John Decker. 2022. “Making the Desert Island Discs Dataset: Data Visceralization and How We Don’t Know What We Know.” 2022. https://studentwork.prattsi.org/data-visceralization/.
D’Ignazio, Catherine. 2017. “Creative Data Literacy: Bridging the Gap between the Data-Haves and Data-Have Nots.” Information Design Journal 23 (1): 6–18. https://doi.org/10.1075/idj.23.1.03dig.
Finnegan, Bill, Camila Rangel Smith, and Sam Van Stroud. 2021. “Desert Island Disks.” https://doi.org/10.17613/2gg4-hw68.
Greenhalgh, S. P. 2022. “Subjectivity in Data Visualization.” Subjectivity in Data Visualization, 131–41.
Gustar, Sndrew. 2020. “Desert Island Discs – Statistics in Historical Musicology.” April 18, 2020. https://musichistorystats.com/desert-island-discs/.
Hicks, Cat. 2022. “When We Miss Missingness.” Data Science by Design. July 27, 2022. https://datasciencebydesign.org/blog/when-we-miss-missingness.
Jansen, Yvonne, Pierre Dragicevic, Petra Isenberg, Jason Alexander, Abhijit Karnik, Johan Kildal, Sriram Subramanian, and Kasper Hornbæk. 2015. “Opportunities and Challenges for Data Physicalization.” In Proceedings of the 33rd Annual ACM Conference on Human Factors in Computing Systems, 3227–36. Seoul Republic of Korea: ACM. https://doi.org/10.1145/2702123.2702180.
Morgan, Paige. 2018. “BBC Desert Island Discs Dataset v 1.0.” https://doi.org/10.17613/M6RJ48T8X.
Noë, Alva. 2006. Action in Perception. The MIT Press.
“Recursion.” 2025. In Wikipedia. https://en.wikipedia.org/w/index.php?title=Recursion&oldid=1272345034.
Stark, Luke. 2014. “Come on Feel the Data (and Smell It).” The Atlantic. May 19, 2014. https://www.theatlantic.com/technology/archive/2014/05/data-visceralization/370899/.
WERNIMONT, JACQUELINE. 2021. “Visualizing Energy Data or Visceralizing Energy Transitions – JACQUELINE WERNIMONT.” April 17, 2021. https://jwernimont.com/visualizing-energy-data-or-visceralizing-energy-transitions/.
Wilson, Margaret. 2002. “Six Views of Embodied Cognition.” Psychonomic Bulletin & Review 9 (4): 625–36. https://doi.org/10.3758/BF03196322.
Zhu, Caiwei, Remke Klapwijk, Miroslava Silva-Ordaz, Jeroen Spandaw, and Marc J. de Vries. 2023. “Cognitive and Embodied Mapping of Data: An Examination of Children’s Spatial Thinking in Data Physicalization.” Frontiers in Education 8 (December). https://doi.org/10.3389/feduc.2023.1308117.
Jessika Davis
Jessika Davis is a New York City by way of Rhode Island based researcher, data analyst, knowledge organizer, photographer, performer, dancer, and multimedia artist. She is an avid pattern seeker, whether it be via data, light, space, sound, or the human condition. She received her BFA in Photography at Lesley University College of Art and Design and MS in Museums and Digital Culture at Pratt Institute, with an Advanced Certificate in Digital Humanities. Research areas include: Experiential Data | Multi-sensory Knowledge Making | Information Technology | Linked Open Data | Knowledge Organization | Digital Humanities.