This is the first post in Data Praxis, a new series edited by Thomas Padilla
Matthew Lincoln is a PhD candidate in Art History at the University of Maryland, College Park. Matthew is interested in the potential for computer-aided analysis of cultural datasets to help model long-term artistic trends in iconography, art markets, and social relations between artists in the early modern period. Last summer, Matthew held a fellowship at the Harvard MetaLab workshop Beautiful Data, and presented research at the Alliance for Digital Humanities Organizations’ annual international conference, DH2015, in Sydney, where his paper, “Modeling the (Inter)national Printmaking Networks of Early Modern Europe,” was a finalist for the ADHO Paul Fortier Prize.
Thomas: I’m always interested in the hows and whys of folks getting involved in digitally inflected research. Can you tell us a bit about yourself and describe what motivated you to take a path that brings Art History and digital research together?
Matthew: I suppose my digital art history “origin story” is one of a series of coincidences. I’ve always been interested in programming, and, as an undergraduate, even took a few computer science courses while I was majoring in art history at Williams College. But I’d never seriously considered how to apply those digital skills to historical research while at Williams, nor did I start my graduate work at the University of Maryland with any intention of doing computationally-aided art history there, either. However, as it happened, the same generous donation that made my attendance at UMD possible (a Smith Doctoral Fellowship in Northern European Art), had also funded the Michelle Smith Collaboratory for Visual Culture, an innovative physical space in the Department of Art History & Archaeology that was intended to serve as a focal point for experimenting with new digital means for sharing ideas and research. I was already several years into my coursework before I took a semester-long graduate assistantship in the Collaboratory, where I was given remarkable leeway to explore how the so-called “digital humanities” might inflect research in art history. During that semester, I developed a little toy map generated from part of Albrecht Dürer’s diary of his trip to the Netherlands in 1520-1521. But I also had my eyes opened to the vibrant discourse about digital research in the humanities that had, up to that point, been totally outside my field of view. What is more, data-driven approaches held particular promise for my own corner of art historical research on early modern etchings and engravings. Because of the volume of surviving impressions from this period, a lot of scholarship on printmakers and print publishers comprises a wealth of quantitative description and basic cataloging. My dissertation seeks to mine this existing work for larger synthetic conclusions about print production practices in the Dutch golden age.
Thomas: Over the summer you presented a paper at DH2015 that would become a finalist for the ADHO Paul Fortier Prize, “Modeling the (Inter)national Printmaking Networks of Early Modern Europe.” What were the primary research questions in the paper, and what methods and tools (digital and otherwise) did you employ to pursue those questions?
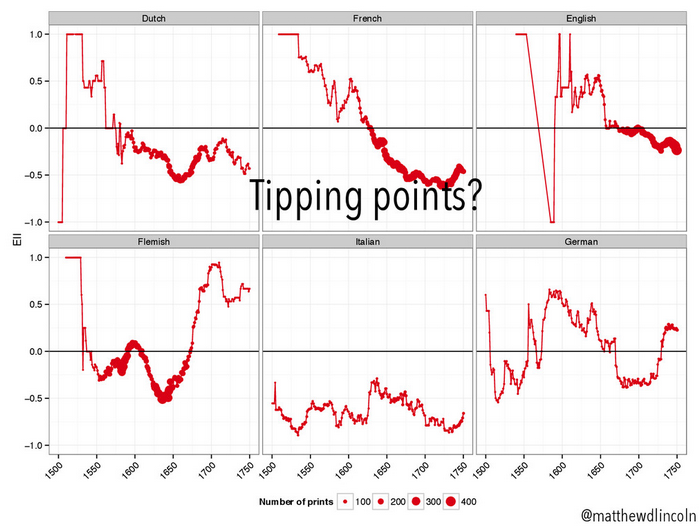
Matthew: I’m interested in how etchings and engravings can serve as an index of past artistic and professional relationships. Most of these objects are the result of many hands’ work: an artist who produced a drawn or painted design, a platecutter who rendered the image onto a printing plate, and often a publisher who coordinated this effort and printed impressions. Seen in this light, the extensive print collections in modern-day collections offer an interesting opportunity to see what kinds of structures emerge from all of this collaboration. In this paper, I wanted to examine how artists tended to connect (or not) across national boundaries. In the history of seventeenth-century Dutch art in particular, there has been a lot of well-deserved attention on the influence and prestige of Dutch painters traveling abroad. But what about printmakers? Did Dutch printmakers tend to connect to fellow Dutch artists more frequently, or did they prefer international collaborators? And how might this ratio have changed over time? It’s easy to intuitively argue either side of this question based on a basic understanding of Dutch history at the time, so this was a good opportunity to introduce some empirical observations and formal measurement to the discussion. In this vein, I’d argue one of my most crucial methods was doing a good old-fashioned literature review in order to properly understand the stakes of the question that I wanted to operationalize.

from DH2015 paper, “Modeling the (Inter)national Printmaking Networks of Early Modern Europe”
I drew on two major datasets for this paper: the collections data of the British Museum, and that of the Rijksmuseum. The British Museum has released their collections data as Linked Open Data, which meant that I needed to invest a considerable amount of time learning SPARQL (the query language for LOD databases) and how to build my own mirror of their datastore in Apache Fuseki, as my queries were too large to submit to their live server. On the other hand, once I had mastered the basic infrastructure of this graph database, it was easy to produce tables from these data exactly suited to the analyses I wanted to do. The Rijksmuseum offers a JSON API service, allowing you to download one detailed object record at time. The learning curve for understanding the Rijksmuseum’s data model was lower than that for the British Museum’s LOD. However, I had to battle many more technical issues, from building Bash scripts to laboriously scrape every object from the Rijksmuseum’s cantankerous API, to figuring out how to break out just the information I needed from the hierarchical JSON that I got in return (jq was a fantastic utility for doing this).
Because I was more interested in looking at particular metrics of these networks rather than producing “spaghetti monster” visualizations like you can produce in a program like Gephi, I turned to the statistical programming language R to perform the actual quantitative analyses. R has been fantastic for manipulating and structuring huge tables of data, running network analysis algorithms (or just about any other algorithm you’d like to run), and then producing publication-quality visualizations. Because everything is scripted, it was easy to document my work and iterate through several different versions of an analysis. In fact, you can download the data and scripts for my DH2015 paper yourself and reproduce every single visualization.
from DH2015 paper, “Modeling the (Inter)national Printmaking Networks of Early Modern Europe”
Thomas: Based on your comments and prior blog posts such as, “Tidy (Art) Historical Data,” it seems that you put a great deal of care into thinking about how your data and research processes are documented and shared. Perhaps it’s a bit of a brusque way to ask, but what made you care? How did you learn how to care? Who did you learn from?
Matthew: I started caring because I saw smart people doing it. I still care because I experienced the practical benefits in a real way. Many of my DH role models put forward careful documentation of their work: Lincoln Mullen’s openly-accessible code, Miriam Posner’s bevy of public DH syllabi, or Caleb McDaniel’s lengthy “backwards survey course” reflection. Here were people doing really useful work, and I was directly benefitting from their openness – so that was absolutely something that I wanted to emulate. On the other side of it, I’ve also had to deal with anti-patterns in documentation. Because I work almost exclusively with data that other people have assembled, I’m painfully conscious of how much the lack of documentation, and/or the assumption that people will only ever use your data the same way that you did, can hinder productive re-use of data.
Now, to be honest, I am not sure if anyone else has directly benefitted yet from looking at my code and data. However, I’ve certainly benefitted from my own documentation! I have been revising an article in response to peer reviews. We all know what that timeline looks like: I “completed” (ha!) the data analysis almost a year ago, finalized and submitted the text with my co-author a month or so after that, then waited many more months before the reviews came back. In just the past month I’ve had to go back in and re-run everything with an updated dataset, clarify some of the analytical decisions made, and enhance several of the visualizations. And I didn’t need to rip my hair out, because all of my work is documented in simple code files, and I don’t have to try and reverse-engineer my own product without the original recipe. (I should note that the R programming community is great for this. It is filled with particularly vocal advocates for reproducible code, like knitr author Yihui Xie, who produce great tools for practicing what they preach.).
By writing documentation notes as I go, I’ve also become much better at explaining – in natural language – what I am doing computationally. This is crucial for any kind of quantitative work, but all the more so in humanities computing, where you can usually count on the fact that most of your audience will have no background in your methodology.
Thomas: Thinking on the digitally inflected research you’ve conducted to date, and the directions you seek to go in the future, what are the most significant challenges you anticipate you will encounter? Accessing data? Sharing your data? Venturing into new methodological terrain? Recognition of the work en route to tenure?
Matthew: I agree with Jacob Price’s assessment of data-driven methods in history: that, however promising, they present major challenges, both in the logistics of producing interoperable data, but also in producing interoperable scholarship: if the skills required to interpret and evaluate data-driven humanistic scholarship remain concentrated in a small corner of our respective fields, and never make it into, say, graduate methodology courses, then the long-term impact of that scholarship will also remain cloistered. One might argue this is surely a solvable problem… but I cite Price because he wrote that in 1969. I am excited to help other scholars implement these approaches in their own research (*cough*I’m available for hire!*cough*), but it is sobering to remember how enduring these problems have been.
Thomas: What recent research has inspired you?
Matthew: Ruth and Sebastian Ahnert’s recent article on English Protestant communities in the 1530s thoughtfully maps formal network concepts onto interesting disciplinary research questions – in their case, examining how Queen Mary I’s campaign to stifle evangelical organization failed to target the most structurally-important members of the dissident correspondence network. Also, I’ve found Ted Underwood’s and Jordan Sellers’ work on machine classification of literary standards to be one of the most fluently-written and compelling explanations of how predictive statistical tools can be used for hypothesis testing in the humanities.
Thomas: Whose data praxis would you like to learn more about?
Matthew: For all the work that I do with art history, I’ve actually done surprisingly little work directly with image data! There are some really interesting questions of stylistic history that I suspect could be informed by applying some fairly basic image processing techniques. I’d like to better understand methods for generating and managing image data and metadata (like color space information), from both the repository/museum perspective (how and why is it produced in the way it is?) as well as a computer vision perspective (how should that metadata be factored into analysis?).
![]() This work is licensed under a Creative Commons Attribution 4.0 International License.
This work is licensed under a Creative Commons Attribution 4.0 International License.
Thomas Padilla
Thomas Padilla is Visiting Digital Research Services Librarian at the University of Nevada Las Vegas. He publishes, presents, and teaches widely on digital scholarship, digital collections, Humanities data, data curation, and data information literacy. He is Principal Investigator of the Institute of Museum and Library Services supported, Collections as Data. Thomas is a member of the Association for Computers and the Humanities Executive Council (2017-2021), the Global Outlook::Digital Humanities Executive Council, the Integrating digital humanities into the web of scholarship with SHARE Advisory Board, and the ARL Fellowship for Digital and Inclusive Excellence Advisory Group.
- Web |
- More Posts
.@DHandLib Data Driven Art History: Framing, Adapting, Documenting, Thomas Padilla https://t.co/lM9Lwhef3A
Data Driven Art History: Framing, Adapting, Documenting #digitalhumanities https://t.co/F99vZgzDgT
RT @DHandLib: Data-Driven Art History | @thomasgpadilla talks w/ @matthewdlincoln in our new Data Praxis series https://t.co/7UPNwTSQM8 #di…
RT @DHandLib: Data-Driven Art History | @thomasgpadilla talks w/ @matthewdlincoln in our new Data Praxis series https://t.co/7UPNwTSQM8 #di…
RT @DHandLib: Data-Driven Art History | @thomasgpadilla talks w/ @matthewdlincoln in our new Data Praxis series https://t.co/7UPNwTSQM8 #di…
RT @DHandLib: Data-Driven Art History | @thomasgpadilla talks w/ @matthewdlincoln in our new Data Praxis series https://t.co/7UPNwTSQM8 #di…
Shoutouts to the @MSCollaboratory and also to @WilliamsCollege for starting me on an interdisciplinary path: https://t.co/rcINQcVvcc
Data Driven Art History: Framing, Adapting, Documenting https://t.co/uNUs9pIFsT via @DHandLib @UMDArtHistory
RT @matthewdlincoln: Shoutouts to the @MSCollaboratory and also to @WilliamsCollege for starting me on an interdisciplinary path: https://t…
RT @matthewdlincoln: Shoutouts to the @MSCollaboratory and also to @WilliamsCollege for starting me on an interdisciplinary path: https://t…
RT @DigSchLibrarian: Data Driven Art History: Framing, Adapting, Documenting https://t.co/uNUs9pIFsT via @DHandLib @UMDArtHistory
RT @DigSchLibrarian: Data Driven Art History: Framing, Adapting, Documenting https://t.co/uNUs9pIFsT via @DHandLib @UMDArtHistory
RT @matthewdlincoln: Shoutouts to the @MSCollaboratory and also to @WilliamsCollege for starting me on an interdisciplinary path: https://t…
RT @DHandLib: Data-Driven Art History | @thomasgpadilla talks w/ @matthewdlincoln in our new Data Praxis series https://t.co/7UPNwTSQM8 #di…
Check out @matthewdlincoln ‘s interview in Data Praxis, a new DH blog. https://t.co/s6yUzRE6zc #arthistory
Data Driven Art History: Framing, Adapting, Documenting ← dh+lib https://t.co/MNvr0Hz4yK
RT @MSCollaboratory: Check out @matthewdlincoln ‘s interview in Data Praxis, a new DH blog. https://t.co/s6yUzRE6zc #arthistory
RT @DHandLib: Data-Driven Art History | @thomasgpadilla talks w/ @matthewdlincoln in our new Data Praxis series https://t.co/7UPNwTSQM8 #di…
RT @DHandLib: Data-Driven Art History | @thomasgpadilla talks w/ @matthewdlincoln in our new Data Praxis series https://t.co/7UPNwTSQM8 #di…
RT @DHandLib: Data-Driven Art History | @thomasgpadilla talks w/ @matthewdlincoln in our new Data Praxis series https://t.co/7UPNwTSQM8 #di…
Data-Driven Art History: Framing, Adapting, Documenting ← dh+lib https://t.co/lNier8Blbl
RT @DHandLib: Data-Driven Art History | @thomasgpadilla talks w/ @matthewdlincoln in our new Data Praxis series https://t.co/7UPNwTSQM8 #di…
RT @DHandLib: Data-Driven Art History | @thomasgpadilla talks w/ @matthewdlincoln in our new Data Praxis series https://t.co/7UPNwTSQM8 #di…
RT @DHandLib: Data-Driven Art History | @thomasgpadilla talks w/ @matthewdlincoln in our new Data Praxis series https://t.co/7UPNwTSQM8 #di…
RT @DHandLib: Data-Driven Art History | @thomasgpadilla talks w/ @matthewdlincoln in our new Data Praxis series https://t.co/7UPNwTSQM8 #di…
Data driven art history https://t.co/CGQXFbC3Bb
RT @EurResearch: Data driven art history https://t.co/CGQXFbC3Bb
RT @EurResearch: Data driven art history https://t.co/CGQXFbC3Bb
RT @EurResearch: Data driven art history https://t.co/CGQXFbC3Bb
RT @DHandLib: Data-Driven Art History | @thomasgpadilla talks w/ @matthewdlincoln in our new Data Praxis series https://t.co/7UPNwTSQM8 #di…
RT @DHandLib: Data-Driven Art History | @thomasgpadilla talks w/ @matthewdlincoln in our new Data Praxis series https://t.co/7UPNwTSQM8 #di…
RT @DHandLib: Data-Driven Art History | @thomasgpadilla talks w/ @matthewdlincoln in our new Data Praxis series https://t.co/7UPNwTSQM8 #di…
RT @DHandLib: Data-Driven Art History | @thomasgpadilla talks w/ @matthewdlincoln in our new Data Praxis series https://t.co/7UPNwTSQM8 #di…
Data-Driven Art History: Framing, Adapting, Documenting #humanities #feedly https://t.co/Yih0pzxw1g
“Data-Driven Art History: Framing, Adapting, Documenting” #digitalhumanities #feedly https://t.co/mhv8Hc2fJx
RT @historyanddigi: “Data-Driven Art History: Framing, Adapting, Documenting” #digitalhumanities #feedly https://t.co/mhv8Hc2fJx
RT @DHandLib: Data-Driven Art History | @thomasgpadilla talks w/ @matthewdlincoln in our new Data Praxis series https://t.co/7UPNwTSQM8 #di…
[…] Source: Data-Driven Art History: Framing, Adapting, Documenting ← dh+lib […]
Data-Driven Art History: Framing, Adapting, Documenting https://t.co/pgjIBGhcjU
Nice interview with @matthewdlincoln on #dh and art history. https://t.co/qdjcpsOOEk (P.S. Thanks for the shout-out!)
RT @wcaleb: Nice interview with @matthewdlincoln on #dh and art history. https://t.co/qdjcpsOOEk (P.S. Thanks for the shout-out!)
RT @wcaleb: Nice interview with @matthewdlincoln on #dh and art history. https://t.co/qdjcpsOOEk (P.S. Thanks for the shout-out!)
Love learning more about my brilliant friend’s work. @matthewdlincoln https://t.co/MbTzTsl5sr
RT @wcaleb: Nice interview with @matthewdlincoln on #dh and art history. https://t.co/qdjcpsOOEk (P.S. Thanks for the shout-out!)
Great interview with @matthewdlincoln on #dh and art history from @thomasgpadilla ‘s new @DHandLib series. https://t.co/ZkxUx0hvYI
It’s not just code+data: the role of ‘a good old-fashioned literature review’ and documentation in #digitalhistory https://t.co/0ll2jF5XDJ
RT @mia_out: It’s not just code+data: the role of ‘a good old-fashioned literature review’ and documentation in #digitalhistory https://t.c…
RT @Baylor_DS: Great interview with @matthewdlincoln on #dh and art history from @thomasgpadilla ‘s new @DHandLib series. https://t.co/ZkxU…
RT @DHandLib: Data-Driven Art History | @thomasgpadilla talks w/ @matthewdlincoln in our new Data Praxis series https://t.co/7UPNwTSQM8 #di…
RT @mia_out: It’s not just code+data: the role of ‘a good old-fashioned literature review’ and documentation in #digitalhistory https://t.c…
@Bard_EH great interview about “Data-Driven Art History” https://t.co/crJTw0qMcR via @DHandLib (thanks @HenryPisciotta !)
Article: Data-Driven Art History: Framing, Adapting, Documenting https://t.co/swdT1Nm8yc
[veille] Data-Driven Art History: Framing, Adapting, Documenting https://t.co/3upcu0gyY4
RT @DHandLib: Data-Driven Art History | @thomasgpadilla talks w/ @matthewdlincoln in our new Data Praxis series https://t.co/7UPNwTSQM8 #di…
RT @EurResearch: Data driven art history https://t.co/CGQXFbC3Bb
RT @EurResearch: Data driven art history https://t.co/CGQXFbC3Bb
RT @EurResearch: Data driven art history https://t.co/CGQXFbC3Bb
RT @EurResearch: Data driven art history https://t.co/CGQXFbC3Bb
RT @EurResearch: Data driven art history https://t.co/CGQXFbC3Bb
RT @DHandLib: Data-Driven Art History | @thomasgpadilla talks w/ @matthewdlincoln in our new Data Praxis series https://t.co/7UPNwTSQM8 #di…
RT @EurResearch: Data driven art history https://t.co/CGQXFbC3Bb
RT @EurResearch: Data driven art history https://t.co/CGQXFbC3Bb
RT @EurResearch: Data driven art history https://t.co/CGQXFbC3Bb
Data-Driven Art History: Framing, Adapting, Documenting https://t.co/qUaa7Yo3GV via @DHandLib
RT @Baylor_DS: Great interview with @matthewdlincoln on #dh and art history from @thomasgpadilla ‘s new @DHandLib series. https://t.co/ZkxU…
RT @DHandLib: Data-Driven Art History | @thomasgpadilla talks w/ @matthewdlincoln in our new Data Praxis series https://t.co/7UPNwTSQM8 #di…
[…] of digitally inflected research, pedagogy, curation, and collection building and augmentation. The first post in that series, an interview with Matthew Lincoln (University of Maryland), was published this past […]