Introduction
I (Theresa Quill) have been teaching with maps in a library context for over a decade; supporting a wide range of disciplines, levels, and topics. Regardless of the discipline, I often use print maps to illustrate concepts such as visual literacy, authority, bias, accuracy, and the information creation process. I also lead library instruction sessions on digital mapping and GIS tools, and have found that if students do not have an introduction to foundational spatial literacy concepts it is easy to get bogged down in the software and lose the thread of why we are mapping. Leanne and I piloted a data physicalization assignment using paper circuit maps in an attempt to talk about mapping and spatial literacy without the distraction of software.
Teaching with Maps
Cartography, even maps that we view as “scientific” or “objective” offers a particular view of place, born from the data and technology available at the time, and reflective of the motivation and viewpoint of the cartographer. Harley wrote that “[maps are] refracted images contributing to a dialog in a socially constructed world” (2001, 53). Viewing maps that were made to be intentionally persuasive and have an obvious point of view (tourist maps, propaganda maps, etc) can be an accessible entry point for talking about how all maps are abstractions and simplifications of the world.
“The Awakening” from Henry Mayer, an example of a persuasive map from the PJ Mode Collection at Cornell University.
Map-making is an iterative process that involves several steps: conception, data gathering, feature plotting, labeling, design, quality control, and dissemination. This is true of historic paper maps, modern maps made with Geographic Information Systems (GIS), and hand-drawn maps. When I teach GIS, I explain how vector data is made up of points, lines, and polygons. A common example is that a road network is likely to be a line feature, country borders are polygons, and points of interest are, well… points. I typically use static images to help explain how these different data types are organized into layers, but I wanted to find a more effective example.
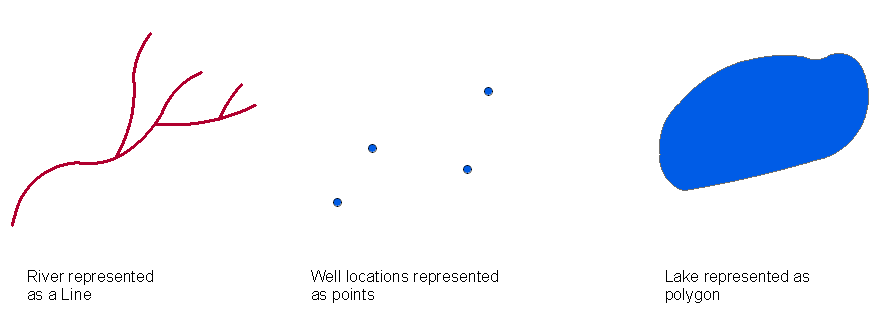
A typical representation of points, lines, and polygons.
Last year I attended a data physicalization workshop that GIS & Research Visualization Librarian Meg Miller (University of Manitoba) led at the Western Association of Map Libraries (WAML) conference where she used embroidery to illustrate these data types. I thought this was such a clear and innovative approach to talking about spatial data without the complication of software, and I have been thinking about ways to incorporate data physicalization into my own work ever since.
Hand-drawn maps are another way to get at these core concepts of cartography and map-making. Through the process of drawing a map, students make decisions about what they will include, but also about scale, relative distance, representation, and abstraction. Through the process of creating maps themselves, students are asked to think about the many ways that features from the real world are abstracted, distorted, and left off of maps. Students as cartographers engage in place-making in a very concrete way that can invite conversations about objectivity, “truth,” and the iterative nature of information creation. This can of course be accomplished by working with GIS and computer cartography as well, but there is something about the physical act of drawing, erasing, and making that gets to the core of these concepts. In their guide to creating hand-drawn maps, Helen Cann remarks, “In all its beautiful fallibility, hand-crafted cartography offers something digital maps could never do; it reveals something richly fascinating about a given landscape, its culture and history, and the unique character of the cartographers themselves” (2018, 9).
Teaching with Paper Circuits
The way that paper circuits bridge the divide between STEM and the arts has always fascinated me (Leanne Nay). It’s a sneaky way to engage artists in STEM and engage STEM folks in the arts. As e-textile designer and educator Leah Buechley explains, “By situating technology in a creative, artistic (feminine) context, e-textiles invite new audiences to the table to tinker and play” (2014, x). I’ve taught paper circuits to high school students at summer camp, families at outreach events, instructors at workshops, and college students in the classroom. The materials are affordable, the process is collaborative, and the end result is endlessly satisfying. Regardless of the context, the novelty of making things light up never wears off.
When I teach paper circuits, I typically lead a demonstration or provide step-by-step instructions, but there is still ample opportunity for trial and error. As with all maker endeavors, the response to “failure” is often the most meaningful. Creating a paper circuit is naturally product-driven: does your LED light up or not? When the LED does not light up, things get interesting. At this moment, participants have to decide how they will proceed. Will they ask for help from the instructor? Will a peer join their cause? Will they stop trying altogether? There are no wrong answers.
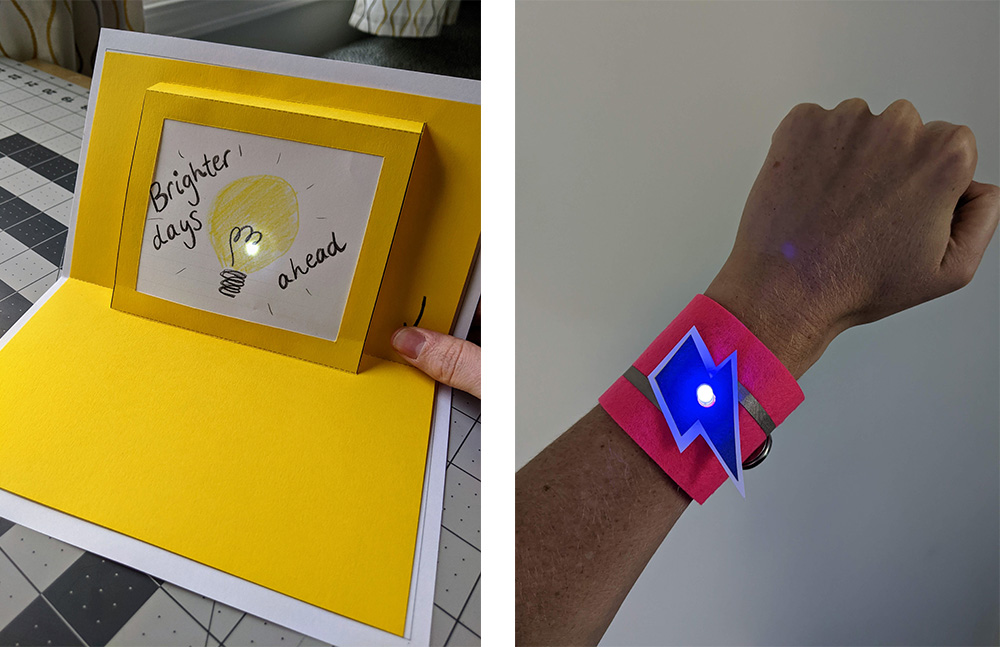
Examples of a paper circuit greeting card and light up wristband.
Geography Class Instruction Sessions
We partnered with faculty member Olga Kalentzidou to incorporate paper circuits and digital mapping into her undergraduate course, Human Geography in a Changing World. During our first class visit, Olga asked her students to “Map YOUR Bloomington.” In 20 minutes, they sketched maps from scratch and did not rely on base maps or templates. After drawing their maps, students walked around the room to see what their classmates created. Their maps illustrated their dorms, study spots, restaurants, and other campus landmarks. As the only non-students in the room, we immediately noticed that their maps almost exclusively represented the university campus, with little attention to the surrounding city.
We joined the class later that week to show them how to incorporate paper circuits into their maps. We started with a brief overview of the supplies and concepts, followed by an open-ended period where they worked together to create their circuits. Our instruction focused on the technical aspects and we did not dictate what the lights should represent. Many students chose to highlight key points on their maps and some constructed paths. We asked students how they decided what to highlight on their maps and heard stories about football games, favorite restaurants, where they live and work, and how they get around town. We also drew maps of our city that were entirely different. Our identities as parents/librarians/adults undoubtedly influenced our choices to map libraries, swimming pools, and other toddler-focused locations around town far from campus.
Analog vs Digital
During that second visit to the class, we talked about what type of spatial analysis we could do with their maps in a visual, and then also a digital/GIS format. Did they notice common themes from the collection of student maps? Were there certain locations that appeared on multiple student maps? Where was the geographic center of their maps, and how did that differ from official city maps?
We planned a second activity, though we ran out of time before we could implement it. We envisioned asking the students to recreate their hand-drawn maps using the GIS software Felt. Students would translate their map locations into points, lines, and polygons with the locations or route of their paper circuit LEDs highlighted as its own “points of interest” layer. Then we could incorporate all of their highlighted data layers into a single map to perform analysis using GIS that would give us quantitative data about which locations or parts of town students in this class frequented or otherwise found significant. Data from a project like this could be used to inform city planners decision making about the placement of infrastructure such as increased sidewalks, bus routes, or public toilet access. This process is referred to as Community Mapping or Asset Mapping.
What started out as a highly individual hand-drawn map about a specific student’s experience and view of Bloomington can be combined with others to give us an idea of the student community. These are themes that Dr. Kalentzidou reinforced in her Human Geography class lectures and readings.
Conclusion
By blending analog and digital methods, students learn mapping concepts and experience the process of information creation. Crafting hand-drawn maps encourages critical engagement with place and paper circuits allow them to continue developing and examining their narrative. Teaching multiple approaches side by side broadens students’ understanding of digital humanities methods.
Pattern: How to Make a Paper Circuit Map
Supplies Needed
- Chibitronics LED stickers*
- Conductive nylon tape
- Coin cell battery CR2032
- Scissors
- Binder clip
- 2 sheets of copy paper
- Colored pencils, crayons, or markers
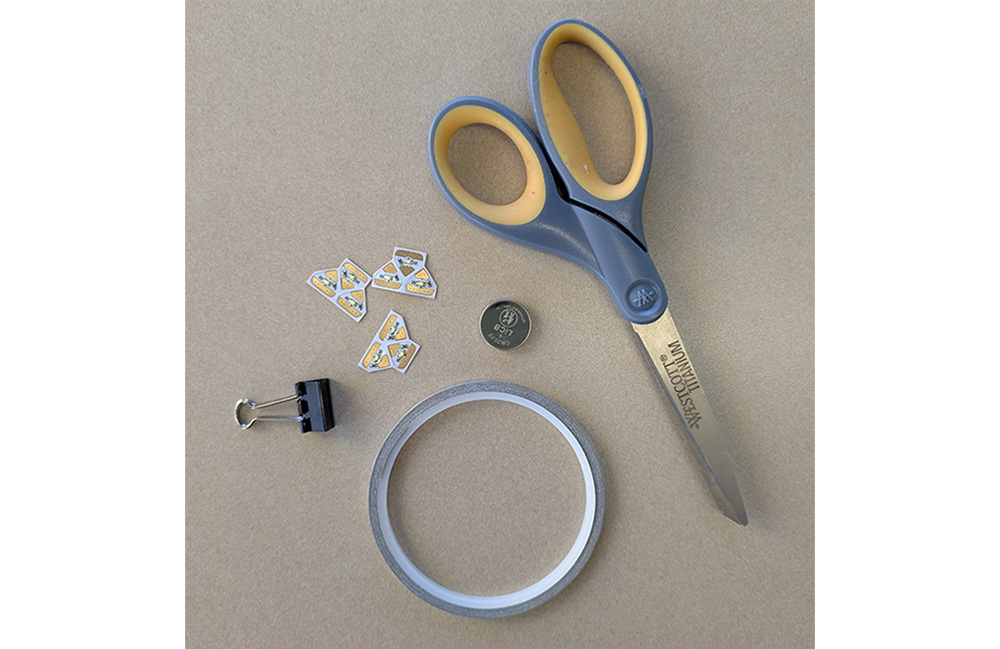
Figure 1. Paper circuit supplies can be purchased from Sparkfun Electronics, Brown Dog Gadgets, Adafruit, or Chibitronics. Chibitronics LED stickers are great for folks who are new to tinkering with electronics, but they are significantly more expensive than regular LEDs. If you decide to use regular LEDs: Use clear tape to hold the legs in place and poke holes through your drawing so they come through your map.
Circuit Fundamentals
A little bit of knowledge about electricity goes a long way towards creating paper circuits!
- LED
- LEDs, or light-emitting diodes, have a positive (+) and a negative (-) side. The orientation of an LED is important for creating a successful circuit. If you’re working with standard LEDs instead of LED stickers, the longer leg is the positive side (+) and the shorter leg is the negative side (-).
- Circuit
- In order to light up an LED, we will use a battery and nylon tape. Current will flow from the battery, through the tape, to our LED. This circular path is known as a circuit.
- Trace
- A trace is the path that connects components in our circuit. We will use nylon tape traces because nylon tape is conductive, meaning it allows electricity to pass through.
Parallel Circuit Example
In this tutorial, we’ll show you how to make a parallel circuit so that you can incorporate multiple LEDs into your design. The actual path of the circuit will depend on the location of your LEDs, but a basic circuit will need a positive trace and a negative trace to allow power to flow from the battery through the LED.
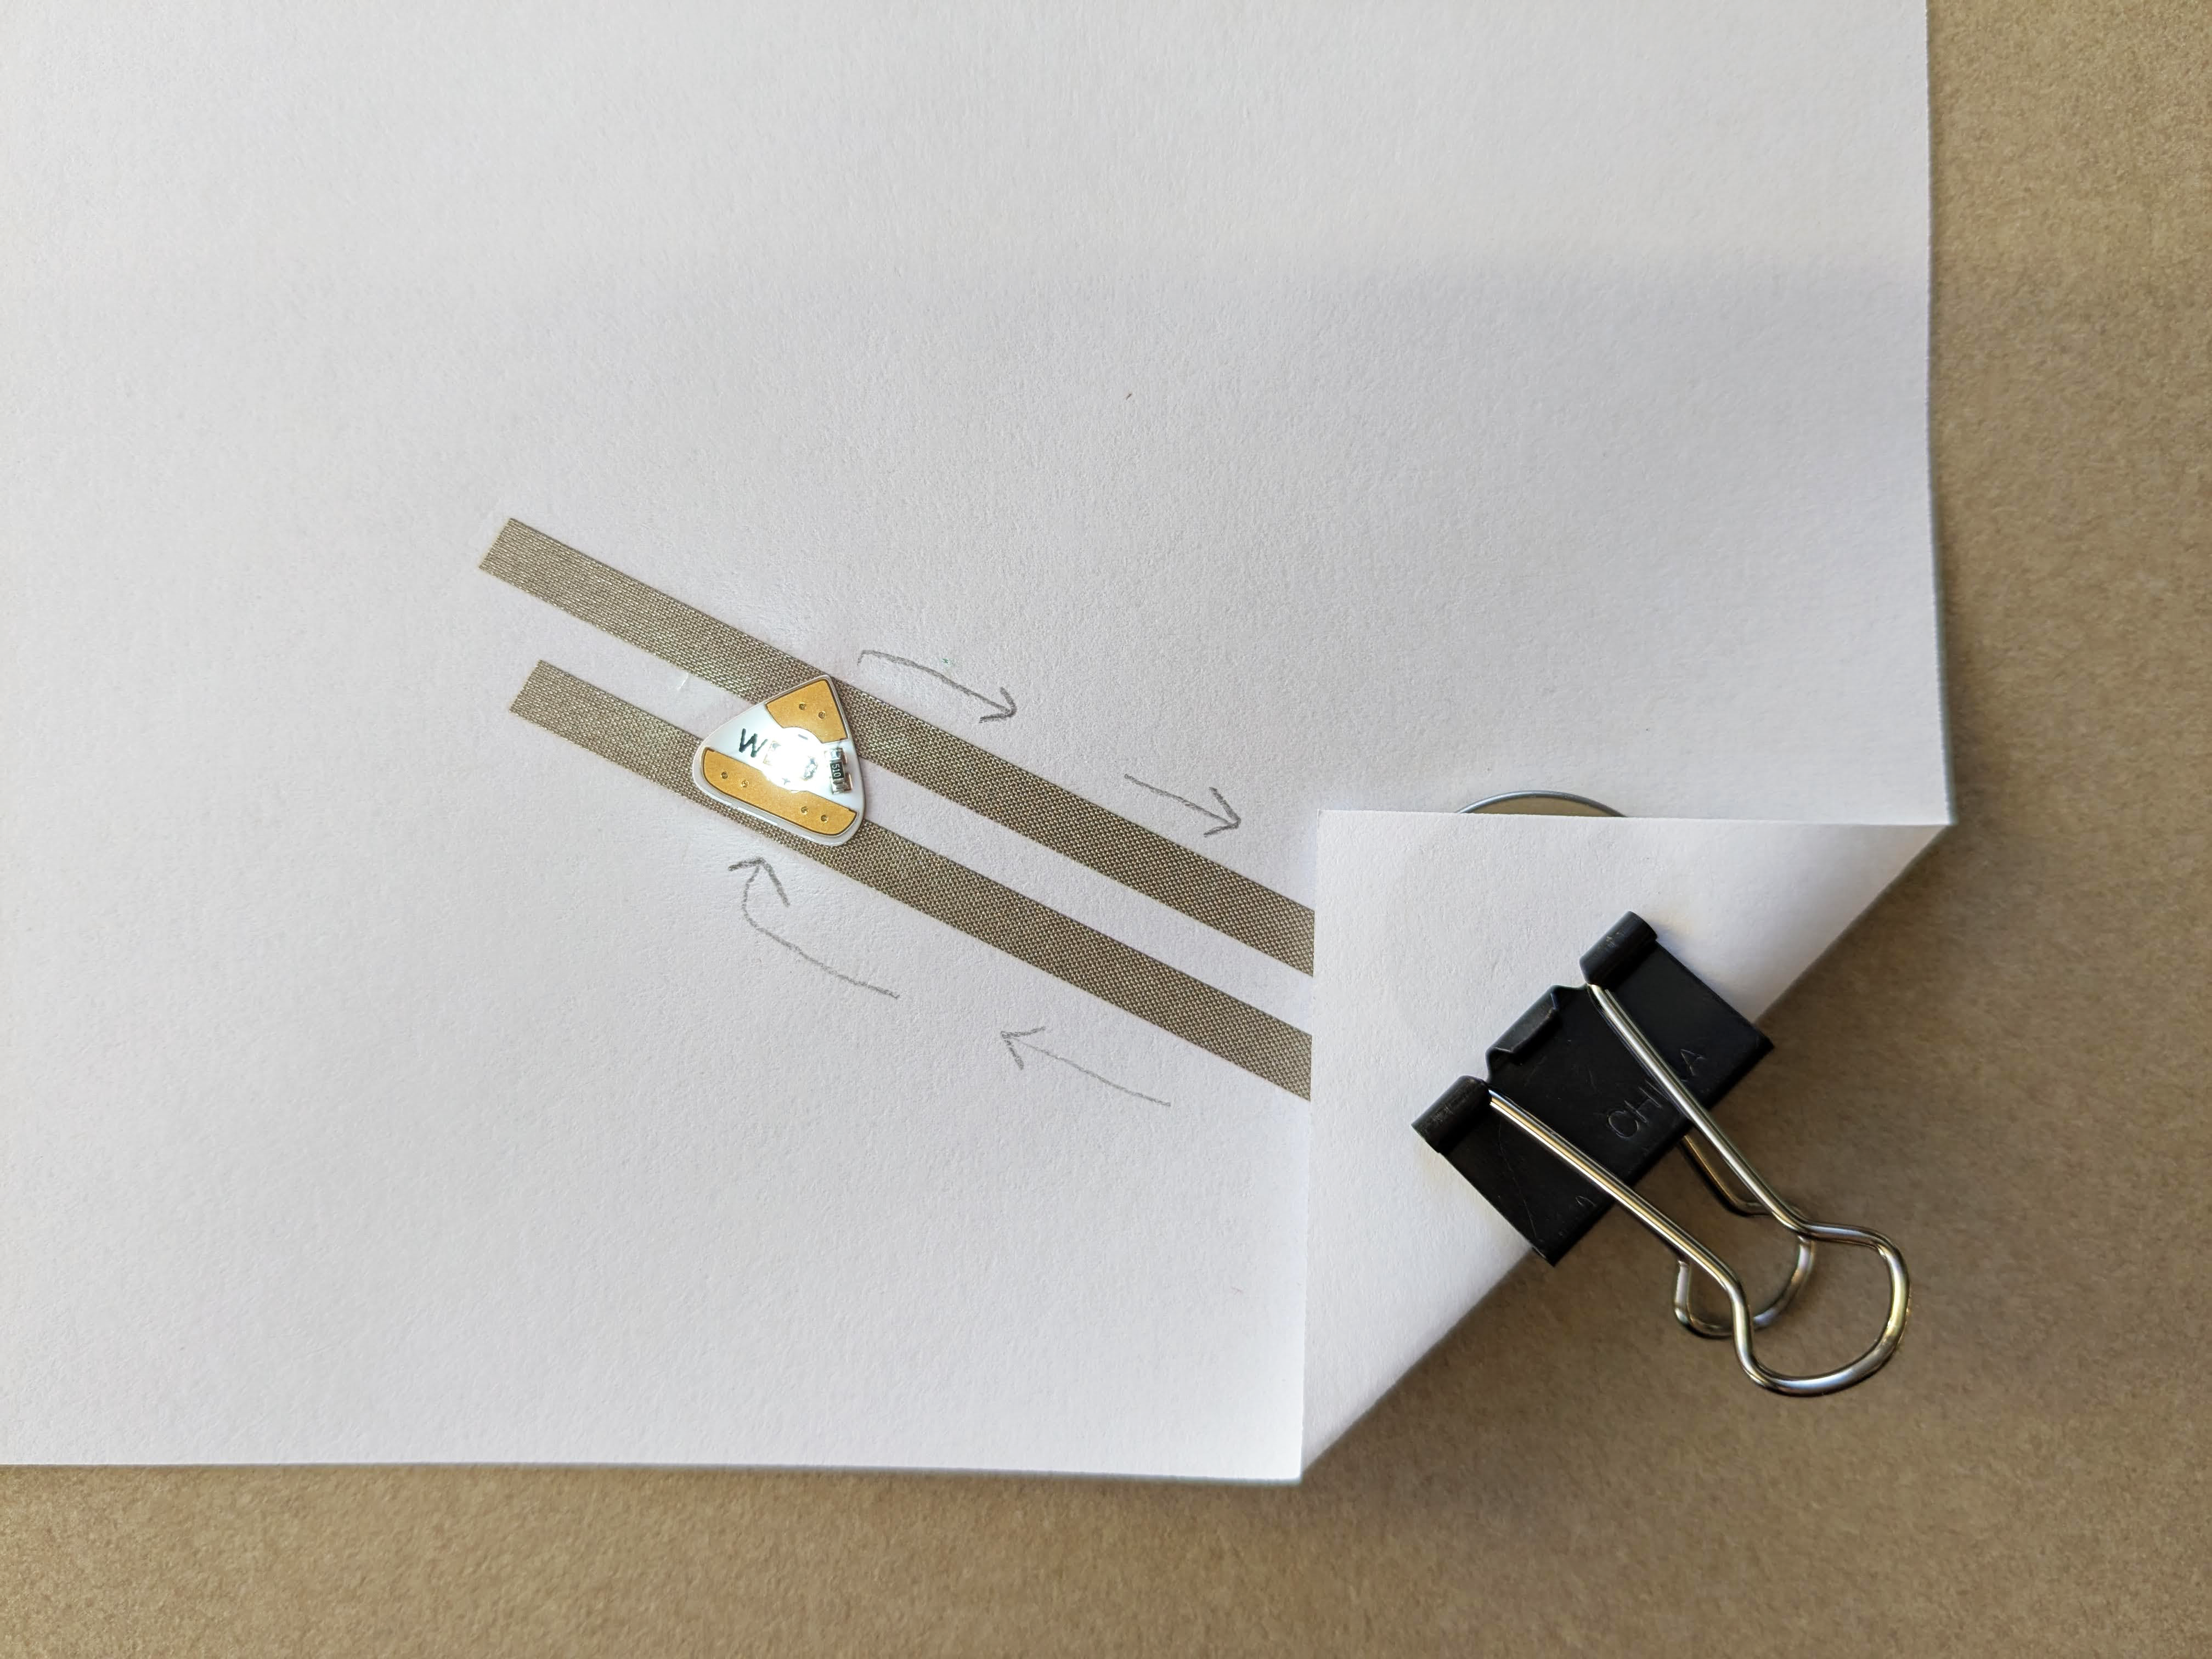
Figure 2. This example illustrates the necessary components of a basic parallel circuit with one LED. We can use this setup to create a larger path with more LEDs.
Step One: Draw Your Map
Start by creating a hand drawn map. If you’re starting from scratch, we recommend choosing a simple prompt and time limit. For example: Map your city in 20 minutes.
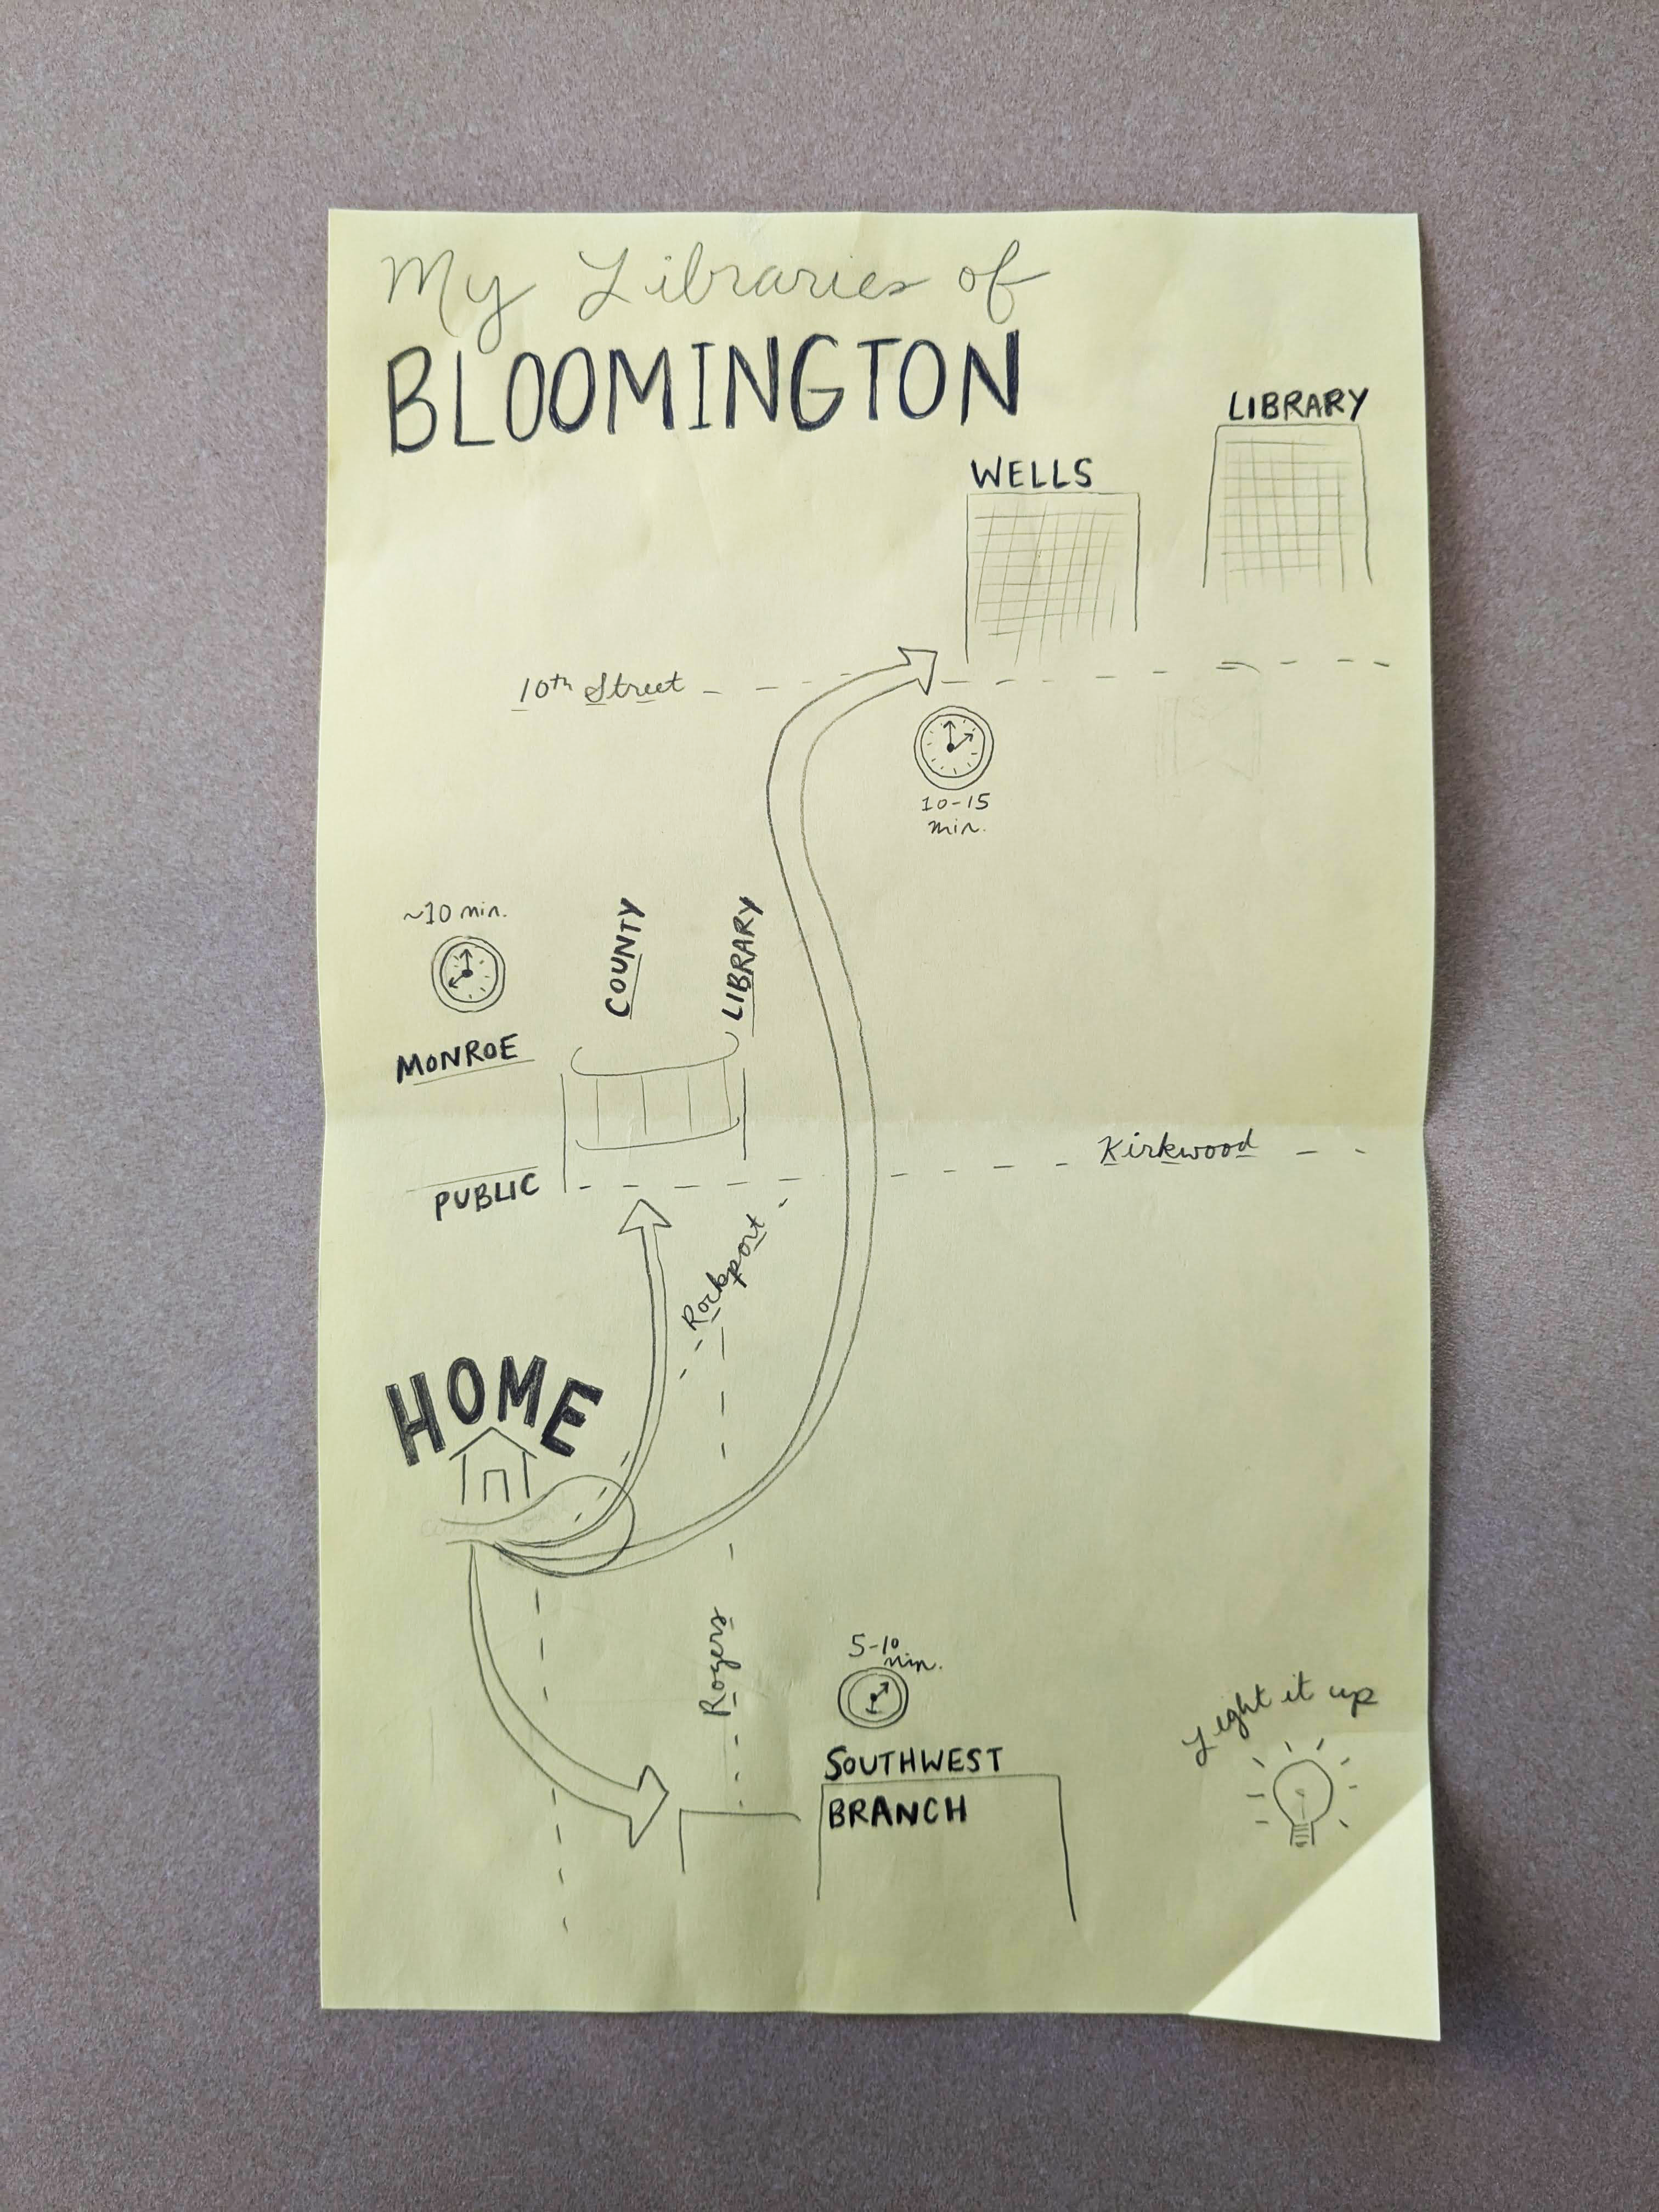
Figure 3. Most of my personal and professional life in Bloomington is spent in various libraries. I mapped three libraries in relation to my house and included the time it takes to get to each library from home.
Consider the following before you begin your circuit:
- Are you working alone or collaborating with others?
- What story do you want to tell?
- How can you emphasize parts of your story with light?
- Will all of your lights turn on together (one circuit) or do you want multiple different sets of lights (multiple circuits)?
- How many LEDs do you want to use?
- Do you want to use different colors?
Step Two: Plot Your Points, Traces, and Battery
We’re going to create a circuit on a separate piece of paper that will sit underneath our map drawing. Next, we’ll plot out the location of our components.
- Place the circuit paper on top of your map to identify the exact spots where you want to have an LED and make a pencil mark.
- The battery will be placed in a corner of the map to create a switch to turn the lights on and off. Sketch out where your battery will be located.
- Finally, sketch out two traces: one that will connect the battery to the positive leads of your LEDs and one that will connect to the negative leads of your LEDs.
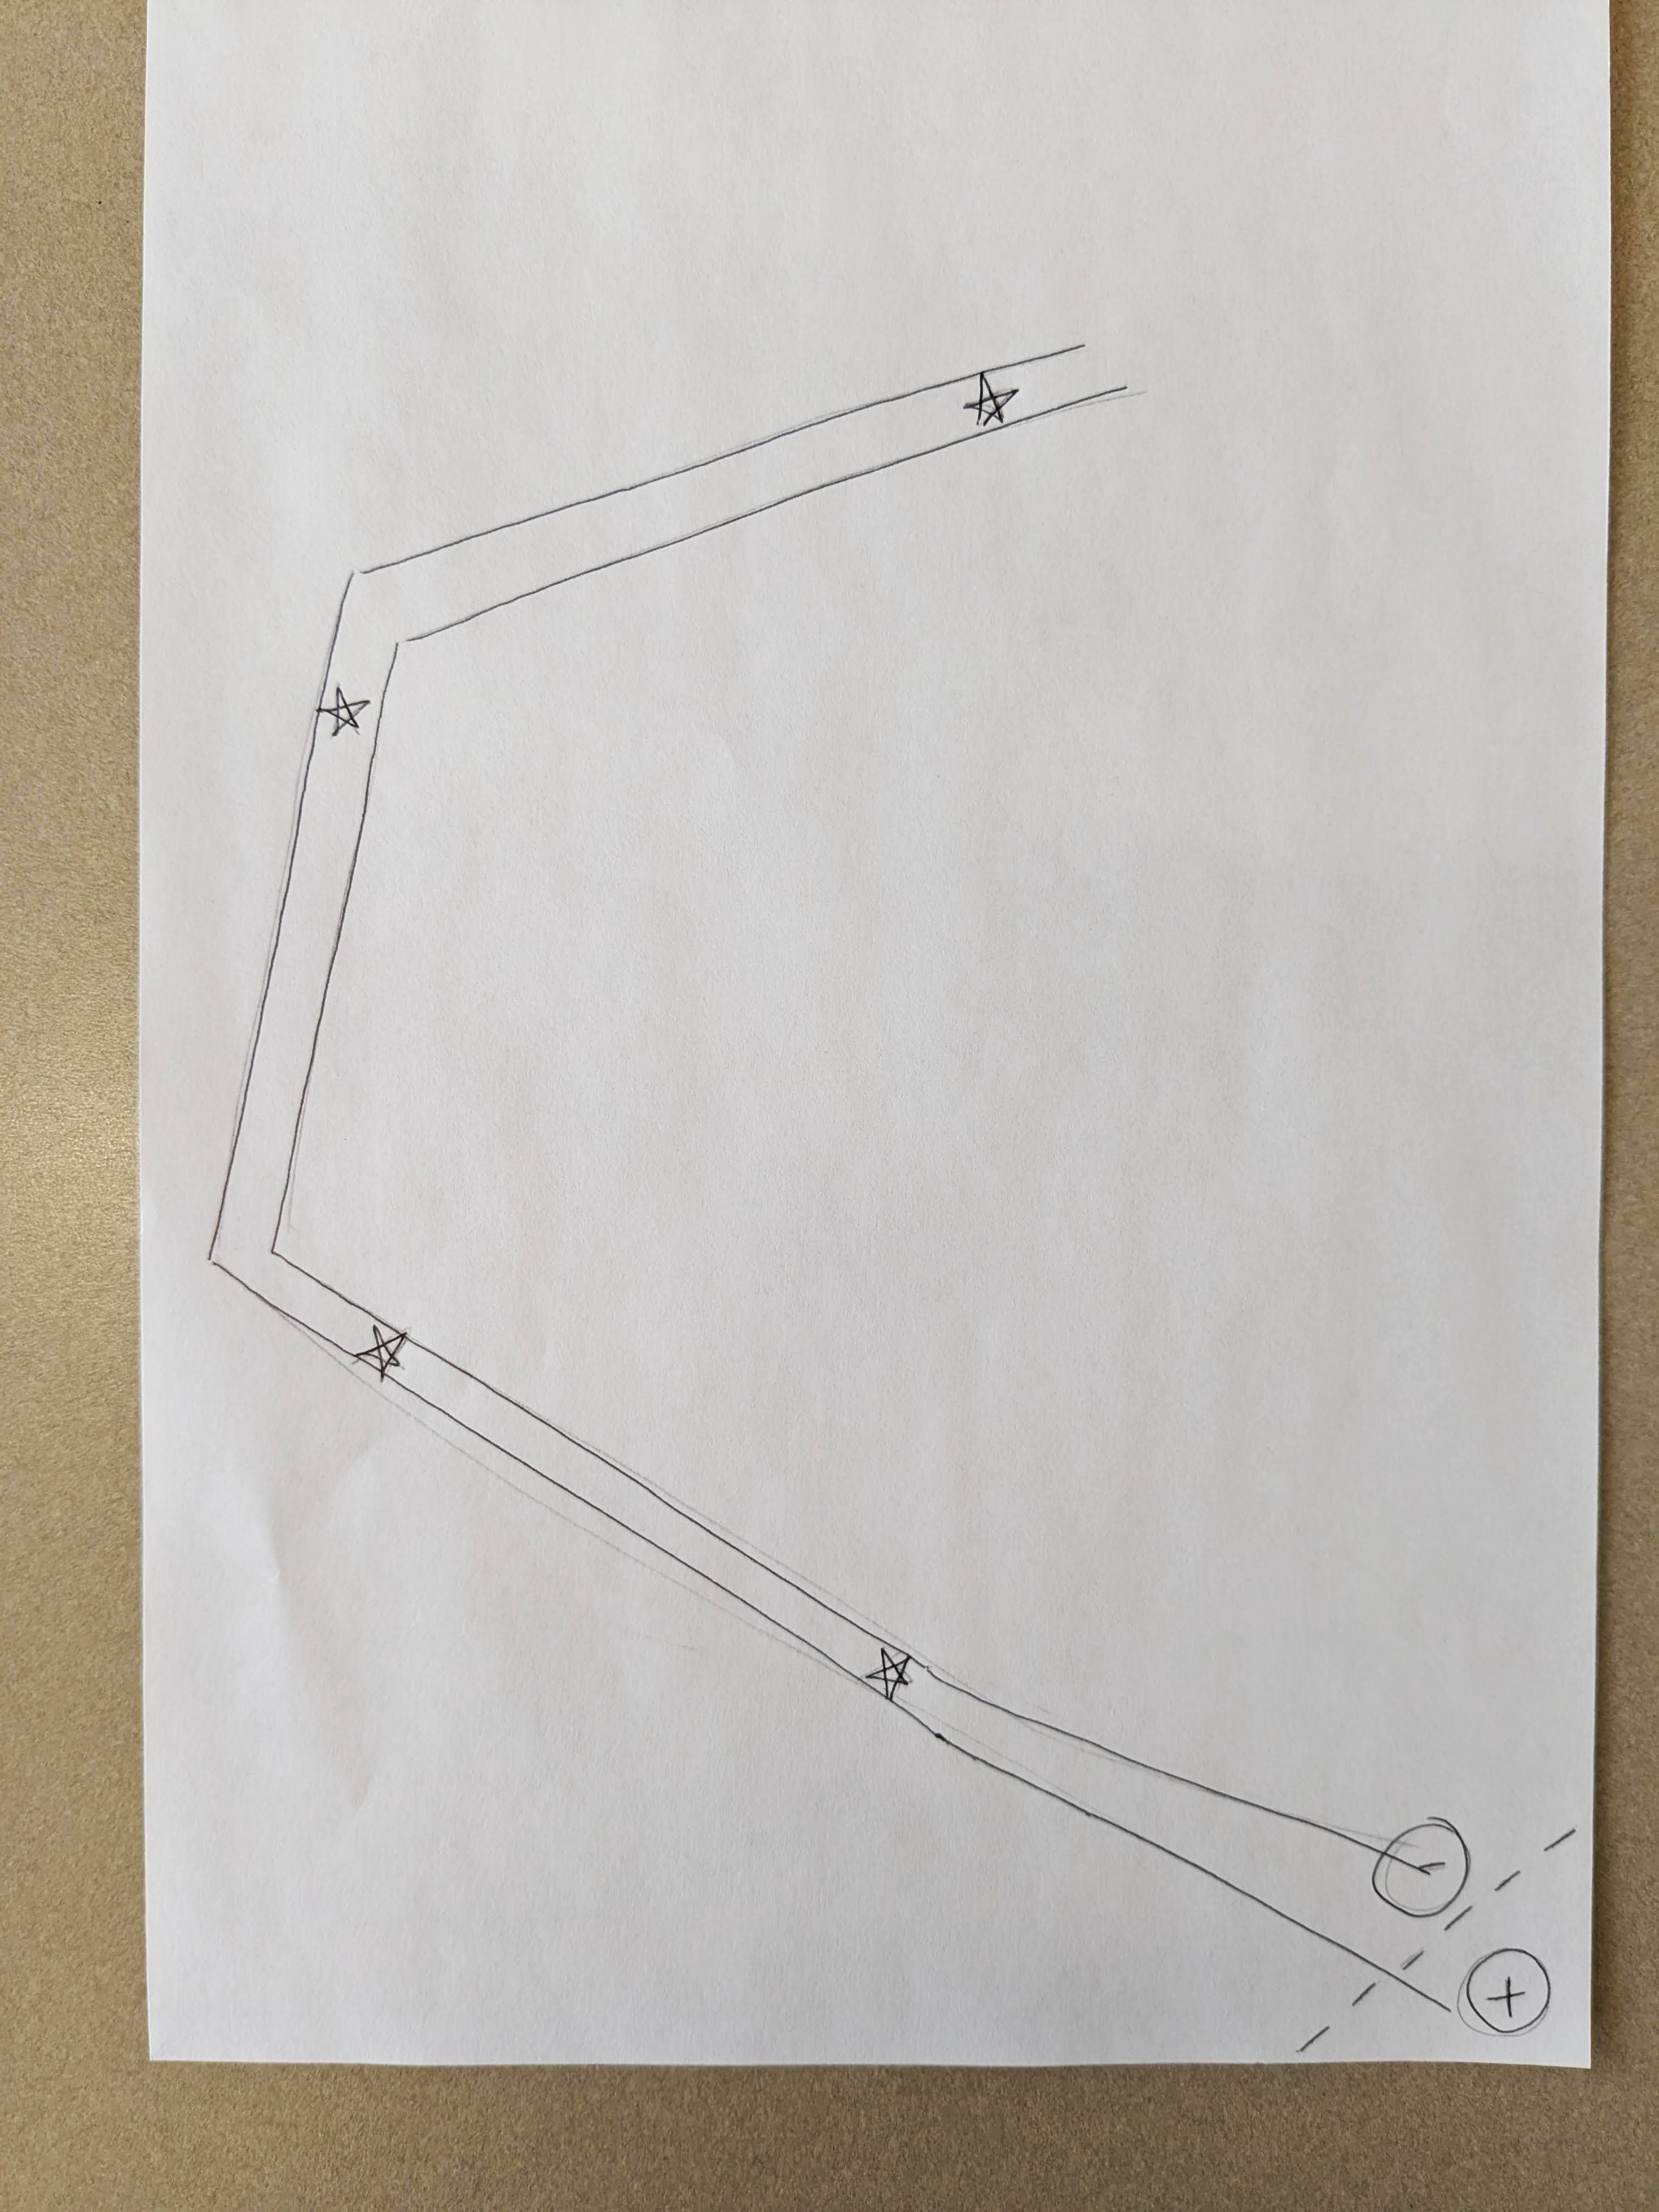
Figure 4. Sketching out the traces ahead of time will save you time and frustration. Sketch your traces close enough that an LED sticker can fit between them. Don’t let the traces overlap or touch or you will get a short circuit (which sounds dramatic, but it simply means your LED won’t light up).
Step Three: Create Traces
Now we’re ready to place the nylon tape on the paper.
- Remove the adhesive backing and stick the tape along the positive and negative paths that you sketched on your paper.
- If you need to round a corner, you can cut the tape and start a new piece. Make sure both pieces of tape make full contact.
Step Four: Add LED stickers
Once your traces are complete, add your LEDs.
- Place your LED stickers so that the positive side is touching the positive trace, and the negative side is touching the negative trace.
Step Five: Add Battery
It’s time to add power to light up our LEDs.
- Place your battery in the corner with the negative side facing down.
- Fold the corner of your paper so the positive trace is resting on the positive side of your battery.
- At this point, you should see light!
- Add a binder clip to hold your battery in place.
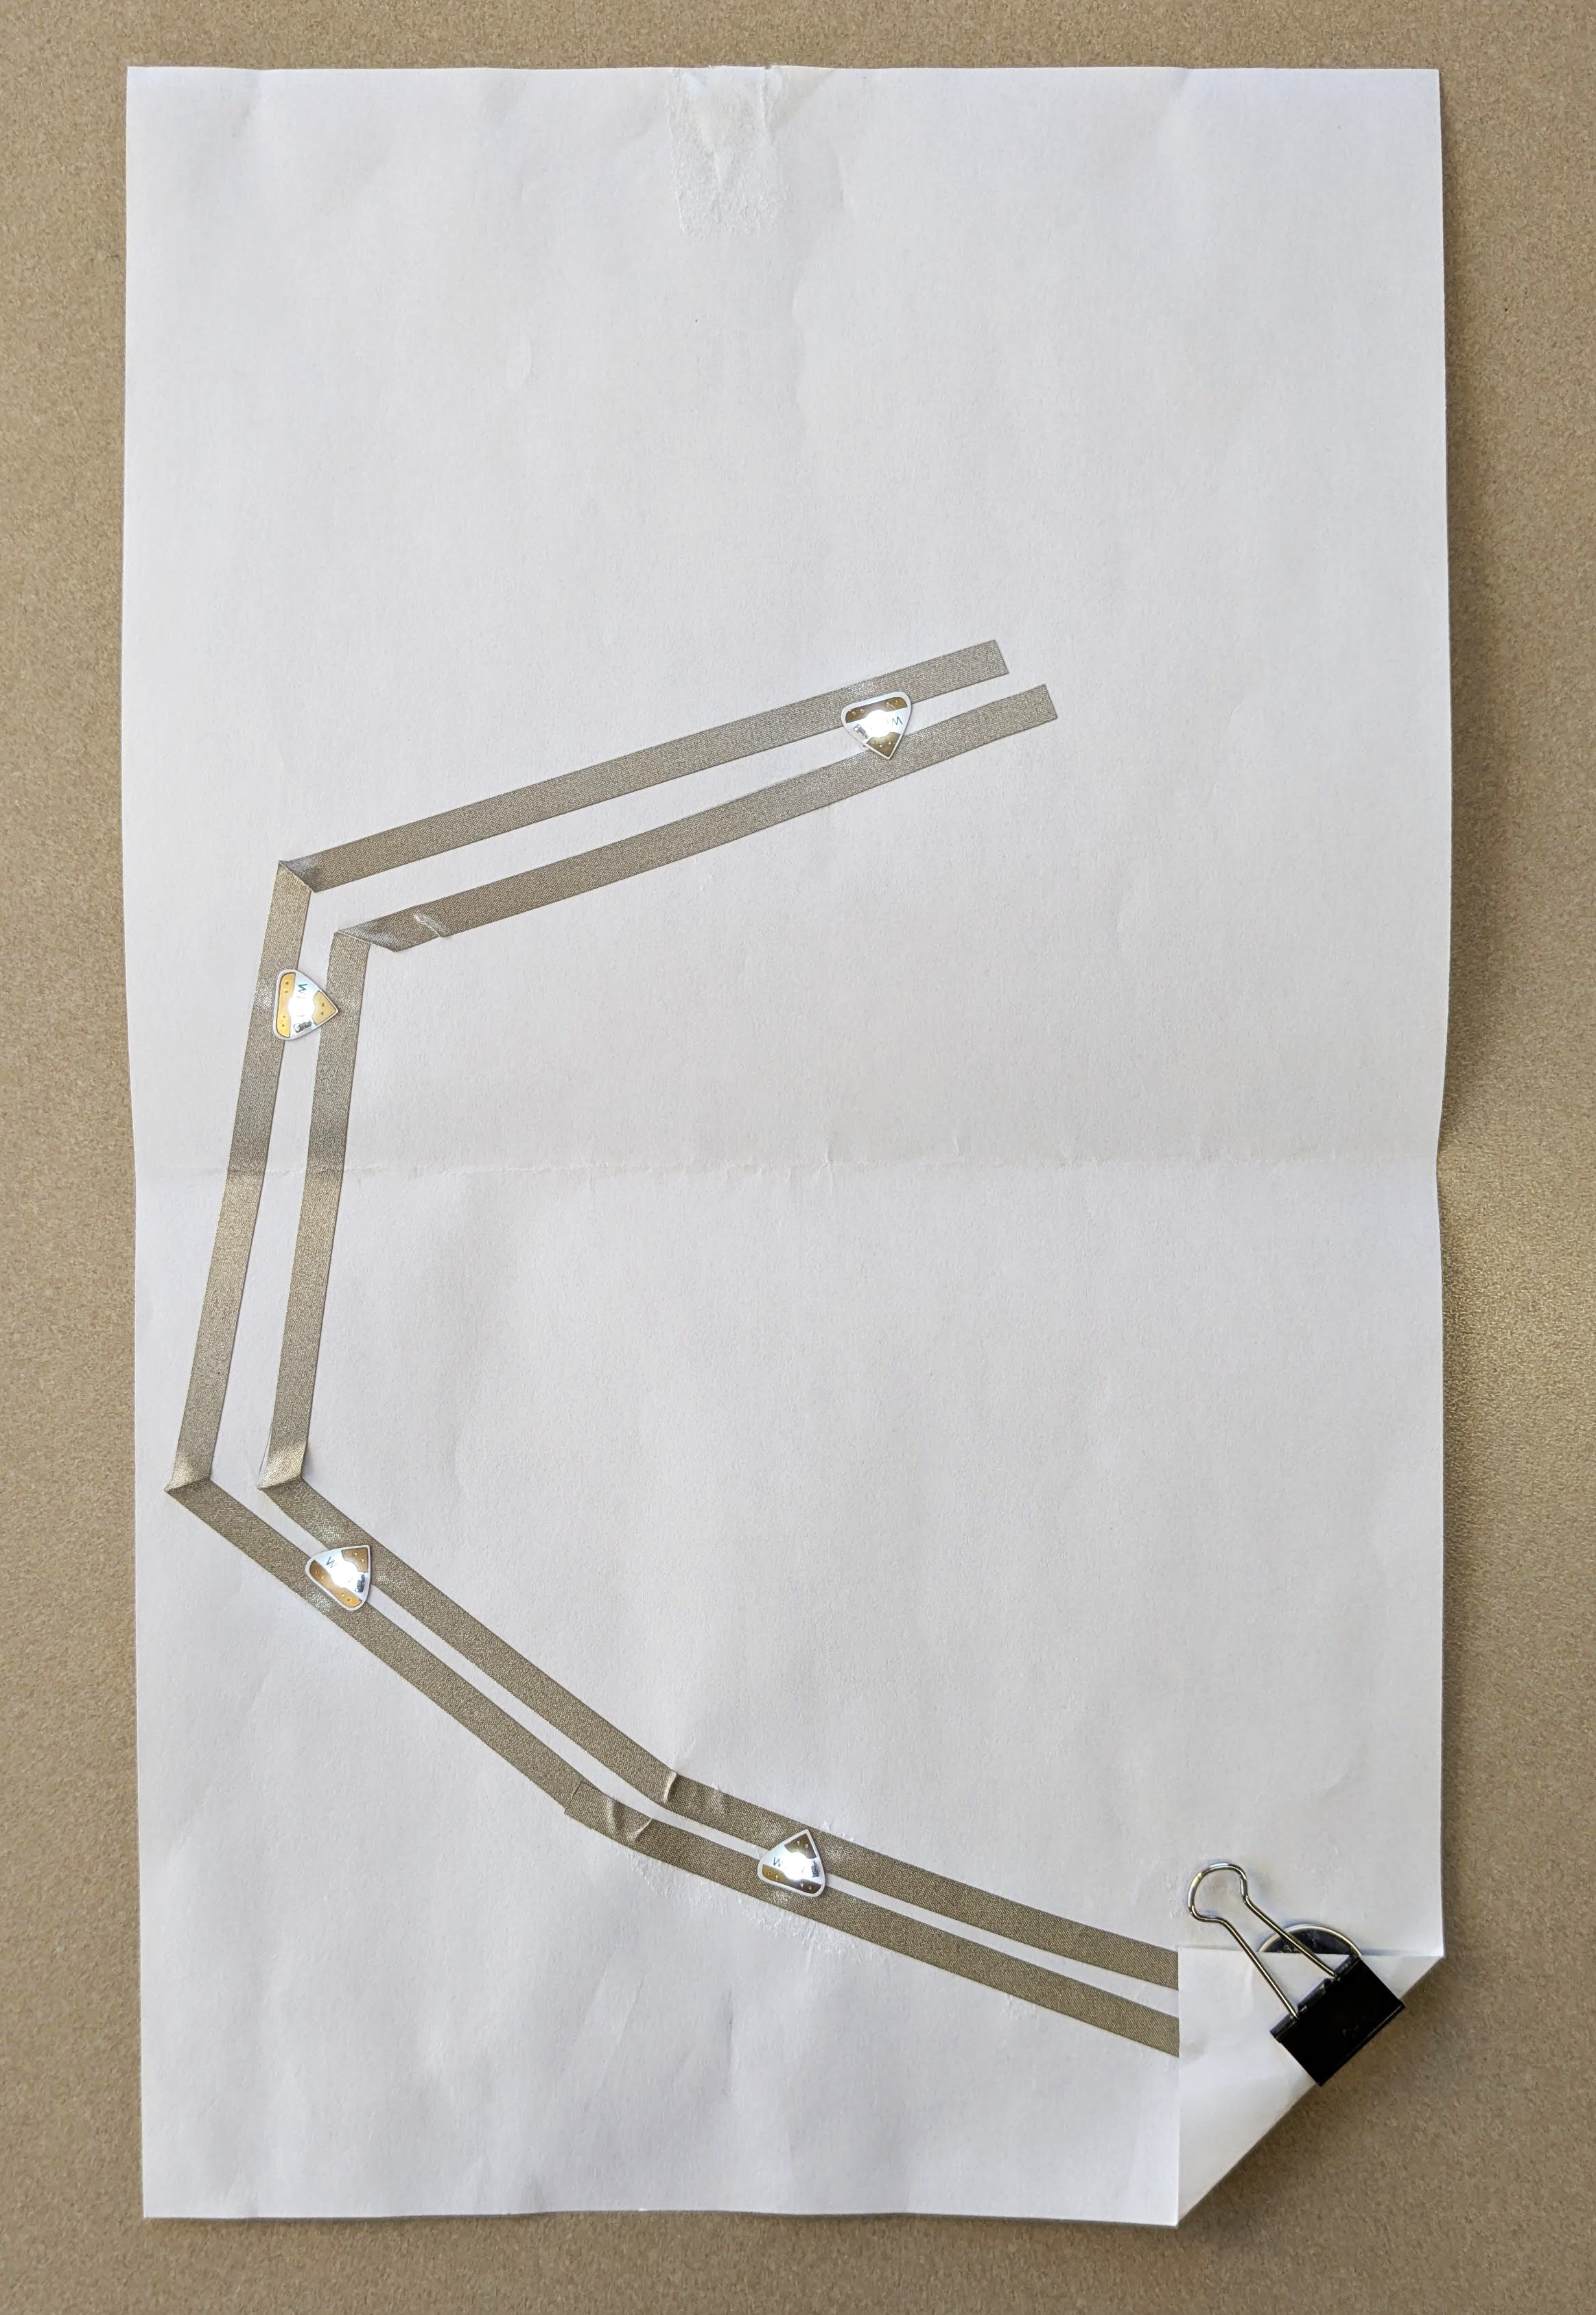
Figure 6. Your completed circuit will rest underneath your hand-drawn map. You can join them together with paper clips or glue to keep everything in place.
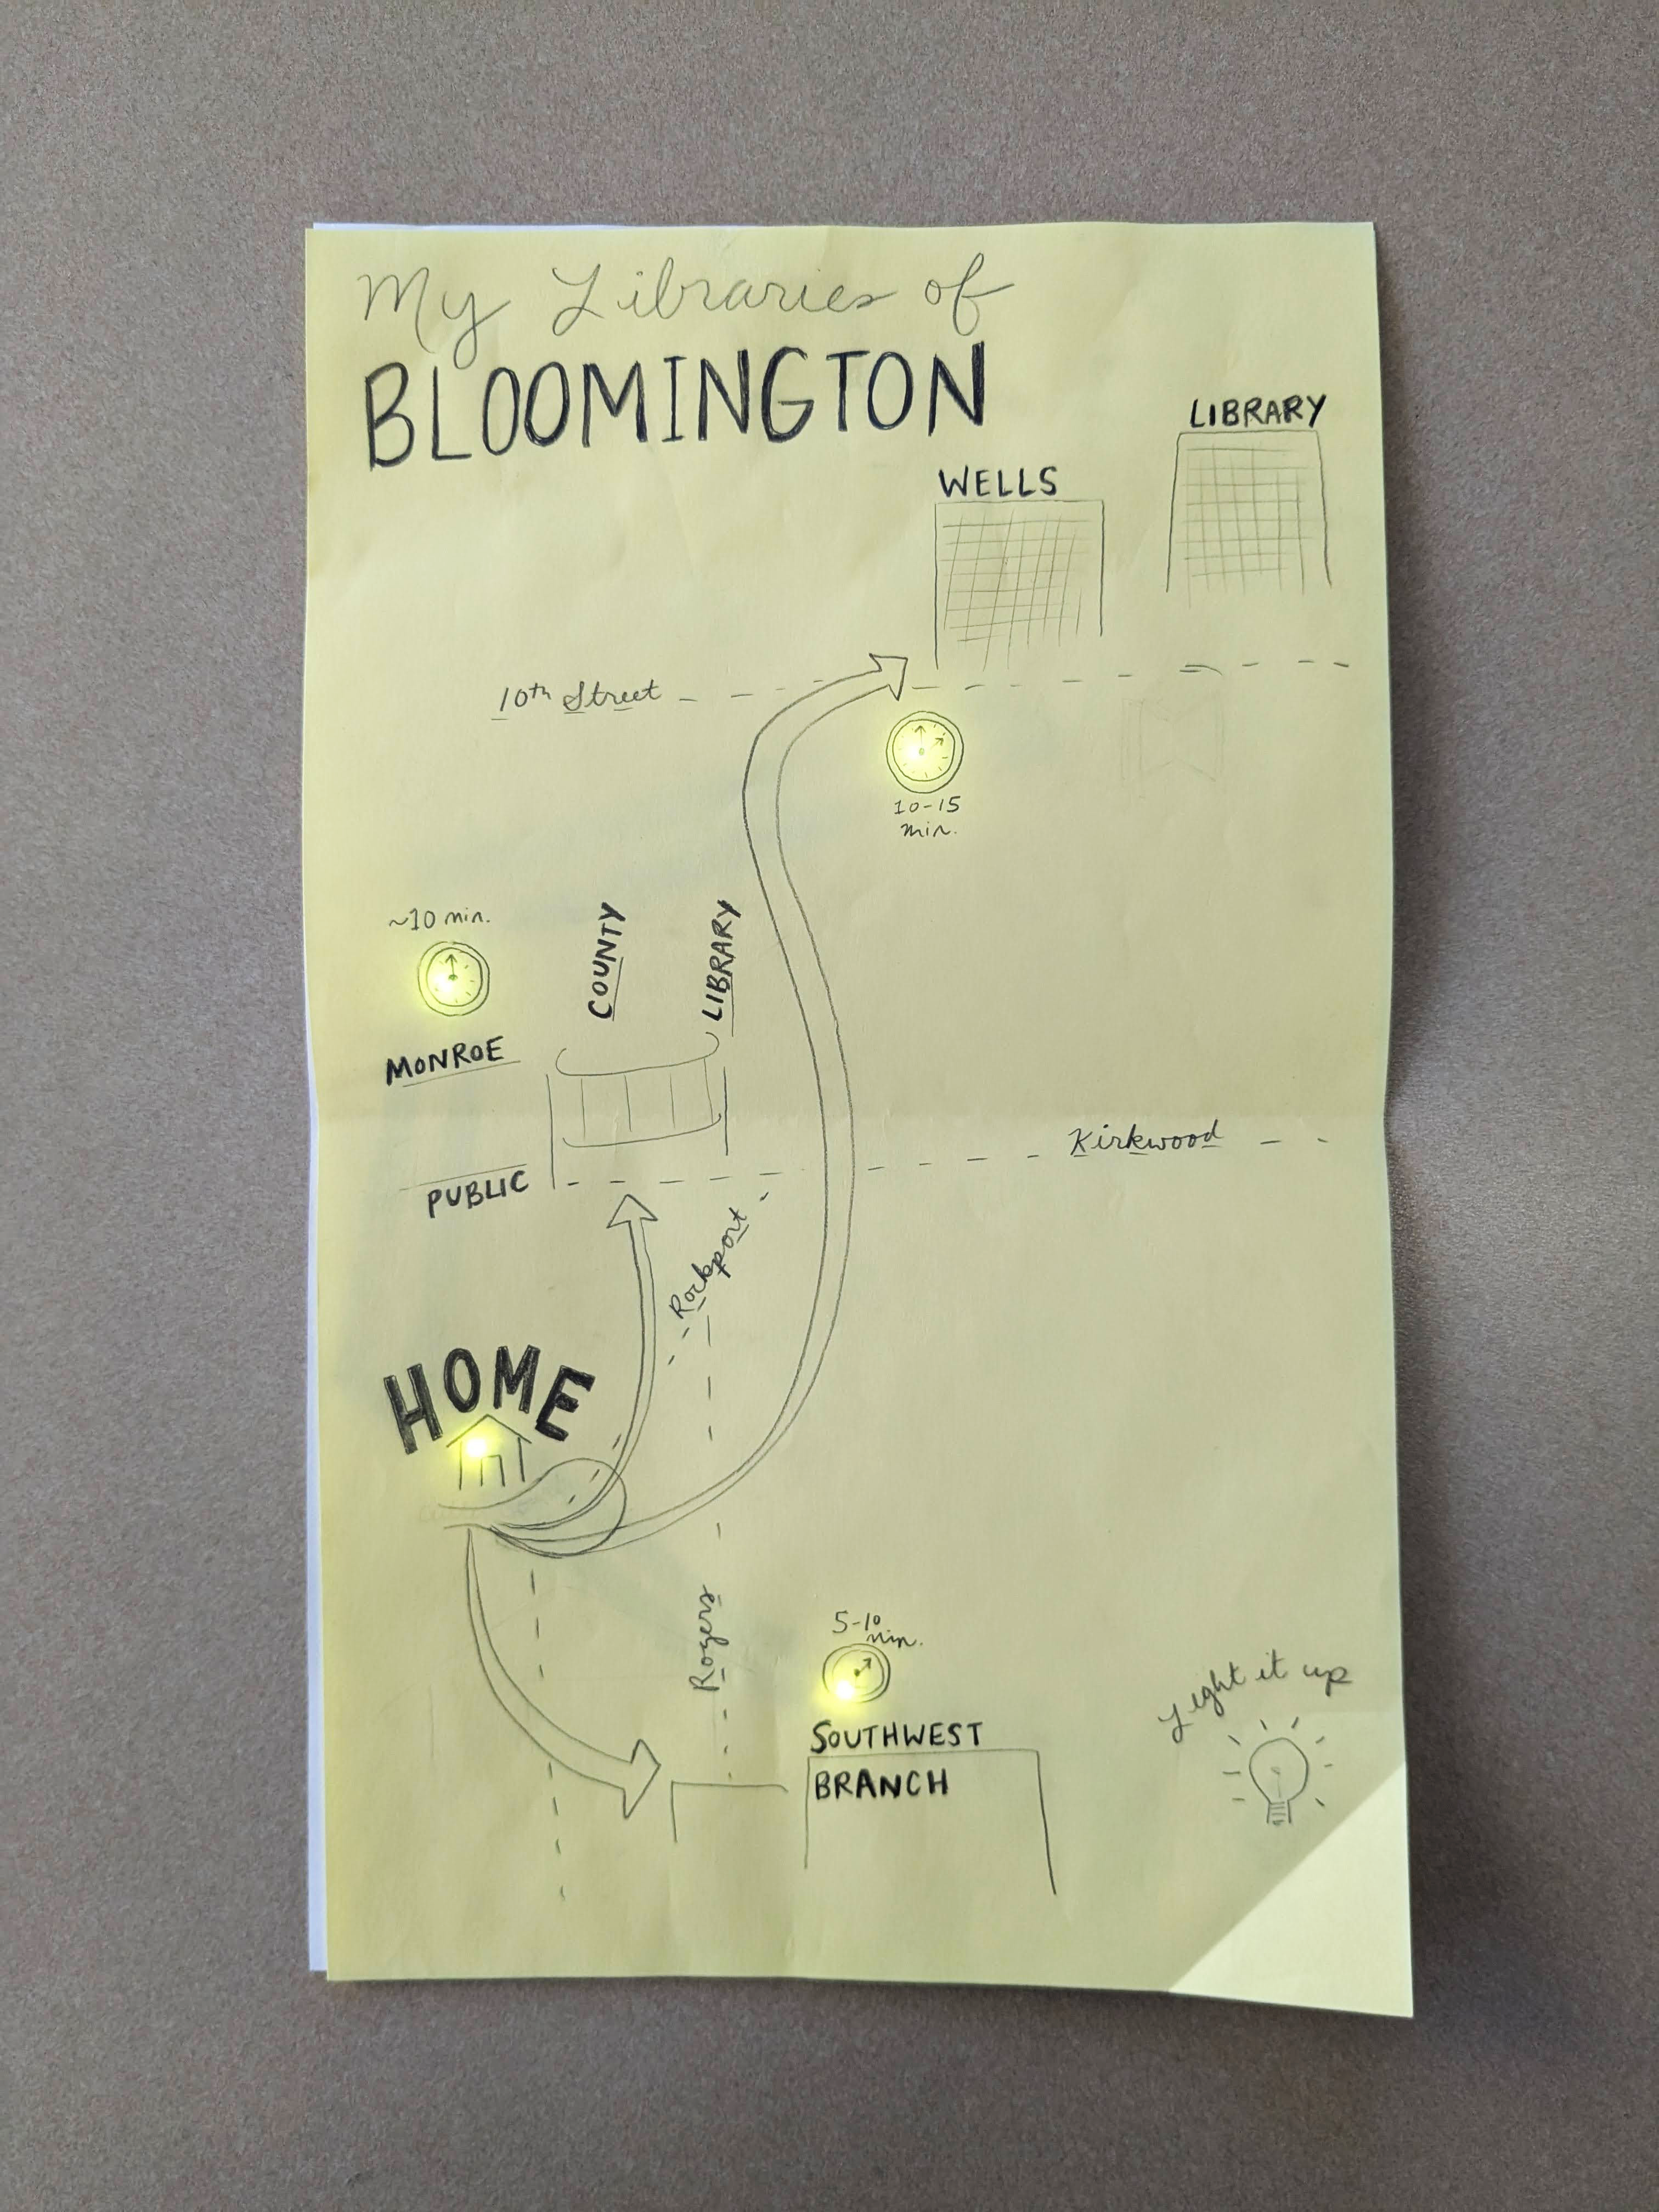
Figure 7. You map is complete!
Troubleshooting
If your circuit doesn’t light up, have no fear! Consider the following troubleshooting tips.
- Check the connections
- Make sure your LED stickers are making full contact with the nylon tape.
- Check the orientation
- Check the positive and negative orientation of the LED stickers.
- Check for short circuits
- Confirm that the positive and negative tape traces do not overlap or touch, this will prevent the current from flowing.
- Check the battery
- Ensure that the battery is sandwiched firmly between the top and bottom tape lines, making full contact with the tape.
References
Buechley, Leah. 2014. Foreword to Soft Circuits : Crafting E-Fashion with DIY Electronics, by Kylie Peppler, Melissa Gresalfi, Katie Salen Tekinbas, and Rafi Santo, x. Cambridge, Massachusetts: The MIT Press.
Cann, Helen. 2018. How to Make Hand-Drawn Maps : A Creative Guide with Tips, Tricks, and Projects. La Vergne: Chronicle Books LLC.
Harley, J. B. 2001. The New Nature of Maps: Essays in the History of Cartography. Edited by Paul Laxton. Baltimore, Maryland: Johns Hopkins University Press.

Theresa Quill
Theresa Quill is the Map and Spatial Data Librarian at Indiana University Bloomington where she curates map collections, liaises with the Department of Geography, and supports faculty and students in spatial data inquiries across disciplines. Her research interests include humanitarian mapping, critical cartography, spatial humanities, and teaching with maps. Theresa is a current co-editor of the Journal of Map & Geography Libraries and she teaches a course on Map and GIS Librarianship in the Luddy School of Informatics, Computing, and Engineering at Indiana University Bloomington.

Leanne Nay
Leanne Nay is the Creative Technologies Librarian at Indiana University Bloomington where she manages the Wells Library Makerspace. Her research explores gender imbalance and belonging in library makerspaces. Leanne is an adjunct instructor in the Luddy School of Informatics, Computing, and Engineering and a faculty champion for the Center of Excellence for Women and Technology 3D Printing and Design Team.